W&T Offshore, Inc. (WTI): Price and Financial Metrics
WTI Price/Volume Stats
Current price | $4.00 | 52-week high | $9.16 |
Prev. close | $4.03 | 52-week low | $3.57 |
Day low | $4.00 | Volume | 1,913,700 |
Day high | $4.19 | Avg. volume | 2,726,344 |
50-day MA | $4.51 | Dividend yield | N/A |
200-day MA | $5.87 | Market Cap | 585.84M |
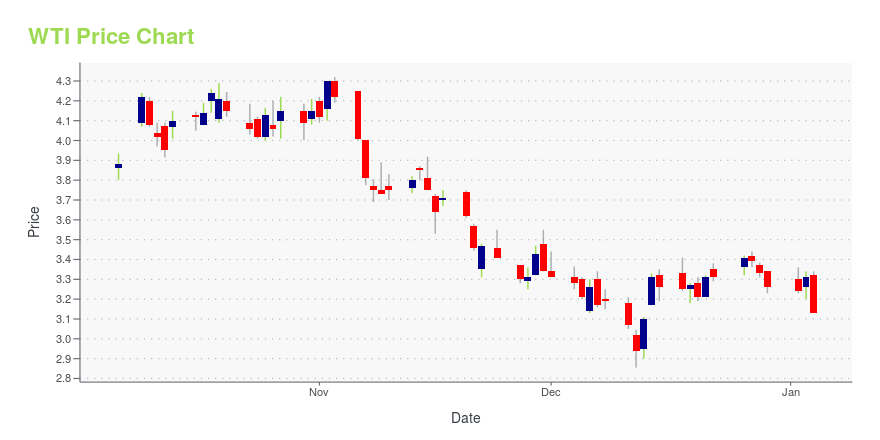
WTI Stock Price Chart Interactive Chart >
WTI POWR Grades
- WTI scores best on the Value dimension, with a Value rank ahead of 95.75% of US stocks.
- WTI's strongest trending metric is Quality; it's been moving down over the last 179 days.
- WTI ranks lowest in Growth; there it ranks in the 0th percentile.
WTI Stock Summary
- W&T OFFSHORE INC's capital turnover -- a measure of revenue relative to shareholder's equity -- is better than 98.87% of US listed stocks.
- WTI's equity multiplier -- a measure of assets relative to shareholders'equity -- is greater than that of merely 0.71% of US stocks.
- In terms of twelve month growth in earnings before interest and taxes, W&T OFFSHORE INC is reporting a growth rate of 1,569.92%; that's higher than 99% of US stocks.
- Stocks that are quantitatively similar to WTI, based on their financial statements, market capitalization, and price volatility, are CCLP, SMFL, MGI, USAC, and BHC.
- Visit WTI's SEC page to see the company's official filings. To visit the company's web site, go to www.wtoffshore.com.
WTI Valuation Summary
- In comparison to the median Energy stock, WTI's price/sales ratio is 50% lower, now standing at 0.7.
- Over the past 223 months, WTI's price/sales ratio has gone down 1.7.
Below are key valuation metrics over time for WTI.
Stock | Date | P/S | P/B | P/E | EV/EBIT |
---|---|---|---|---|---|
WTI | 2023-05-12 | 0.7 | 17.2 | 2.3 | 2.1 |
WTI | 2023-05-11 | 0.7 | 17.1 | 2.3 | 2.1 |
WTI | 2023-05-10 | 0.7 | 17.5 | 2.4 | 2.2 |
WTI | 2023-05-09 | 0.7 | 81.2 | 2.7 | 2.4 |
WTI | 2023-05-08 | 0.7 | 82.9 | 2.7 | 2.4 |
WTI | 2023-05-05 | 0.7 | 81.9 | 2.7 | 2.4 |
WTI Growth Metrics
- Its 4 year cash and equivalents growth rate is now at -62.27%.
- The 5 year net cashflow from operations growth rate now stands at 252.92%.
- The 3 year revenue growth rate now stands at 10.81%.

The table below shows WTI's growth in key financial areas (numbers in millions of US dollars).
Date | Revenue | Operating Cash Flow | Net Income to Common Stock |
---|---|---|---|
2022-09-30 | 896.886 | 349.228 | 236.604 |
2022-06-30 | 764.347 | 325.233 | 131.919 |
2022-03-31 | 623.367 | 116.241 | -43.189 |
2021-12-31 | 558.01 | 133.668 | -41.478 |
2021-09-30 | 487.169 | 105.062 | -99.329 |
2021-06-30 | 425.74 | 61.225 | -74.704 |
WTI's Quality Factors
The “Quality” component of the POWR Ratings focuses on 31 different factors of a companies fundamentals and operational strength. Here are some key insights as we drill into the specifics of these quality attributes.- WTI has a Quality Grade of C, ranking ahead of 45.08% of graded US stocks.
- WTI's asset turnover comes in at 0.456 -- ranking 57th of 137 Petroleum and Natural Gas stocks.
- VLO, HFC, and EOG are the stocks whose asset turnover ratios are most correlated with WTI.
The table below shows WTI's key quality metrics over time.
Period | Asset Turnover | Gross Margin | ROIC |
---|---|---|---|
2021-09-30 | 0.456 | 0.594 | -0.043 |
2021-06-30 | 0.428 | 0.547 | -0.039 |
2021-03-31 | 0.368 | 0.508 | -0.005 |
2020-12-31 | 0.361 | 0.470 | 0.049 |
2020-09-30 | 0.414 | 0.514 | 0.060 |
2020-06-30 | 0.466 | 0.550 | 0.097 |
WTI Price Target
For more insight on analysts targets of WTI, see our WTI price target page. And for a list of of all stocks sorted by upside potential based on analyst target price, see our Top Price Target page.
Average Price Target | $4.93 | Average Broker Recommendation | 1.25 (Strong Buy) |
W&T Offshore, Inc. (WTI) Company Bio
W&T Offshore, Inc. engages in the acquisition, exploration, and development of oil and natural gas properties primarily in the Gulf of Mexico and onshore in the Permian Basin of West Texas. The company was founded in 1983 and is based in Houston, Texas.
Latest WTI News From Around the Web
Below are the latest news stories about W&T OFFSHORE INC that investors may wish to consider to help them evaluate WTI as an investment opportunity.
EnerCom Announces Liberty Energy and Strive Asset Management as Keynote Speakers at EnerCom Denver - The Energy Investment Conference, to be held August 13-16, 2023, in Denver, ColoradoEnerCom, Inc. announced today that Liberty Energy and Strive Asset Management have been added as keynote speakers at EnerCom Denver - The Energy Investment Conference to be held August 13-16, 2023, in Denver, Colorado. |
W&T Offshore (NYSE:WTI) shareholders have earned a 16% CAGR over the last three yearsW&T Offshore, Inc. ( NYSE:WTI ) shareholders might be concerned after seeing the share price drop 28% in the last... |
W&T Announces Participation in Upcoming Investor EventsHOUSTON, May 25, 2023 (GLOBE NEWSWIRE) -- W&T Offshore, Inc. (NYSE: WTI) (“W&T” or the “Company”) today announced that the Company will be participating at the following upcoming investor events: Louisiana Energy Conference 2023 – New Orleans – Chairman and Chief Executive Officer Tracy W. Krohn will participate in a Gulf of Mexico-focused panel discussion on Tuesday, May 30, 2023 and management will host one-on-one meetings with investors during the event.Bank of America Securities 2023 Energy |
7 Energy Stocks That Are Doomed to Fail in the Clean Energy TransitionThese energy stocks certainly stand a chancel of failing over the long-term, as the clear energy transition continues to take off. |
EnerCom Announces that Registration is Now Open for EnerCom Denver® - The Energy Investment Conference, to be held August 13-16, 2023, in Denver, ColoradoEnerCom, Inc. announced today that registration is open for EnerCom Denver® - The Energy Investment Conference. Institutional investors, portfolio managers, financial analysts, CIOs, and other investment community and industry professionals are encouraged to register now for EnerCom Denver - The Energy Investment Conference, which will take place August 13-16, 2023, at the Westin Denver Downtown. |
WTI Price Returns
1-mo | -6.32% |
3-mo | -31.15% |
6-mo | -29.08% |
1-year | -49.62% |
3-year | 21.21% |
5-year | -40.39% |
YTD | -28.32% |
2022 | 72.76% |
2021 | 48.85% |
2020 | -60.97% |
2019 | 34.95% |
2018 | 24.47% |
Continue Researching WTI
Want to do more research on W&T Offshore Inc's stock and its price? Try the links below:W&T Offshore Inc (WTI) Stock Price | Nasdaq
W&T Offshore Inc (WTI) Stock Quote, History and News - Yahoo Finance
W&T Offshore Inc (WTI) Stock Price and Basic Information | MarketWatch
Loading social stream, please wait...