
Willamette Valley Vineyards, Inc. (WVVI): Price and Financial Metrics
WVVI Price/Volume Stats
| Current price | $3.70 | 52-week high | $6.40 |
| Prev. close | $3.65 | 52-week low | $3.57 |
| Day low | $3.70 | Volume | 600 |
| Day high | $3.72 | Avg. volume | 3,917 |
| 50-day MA | $4.00 | Dividend yield | N/A |
| 200-day MA | $4.82 | Market Cap | 18.37M |
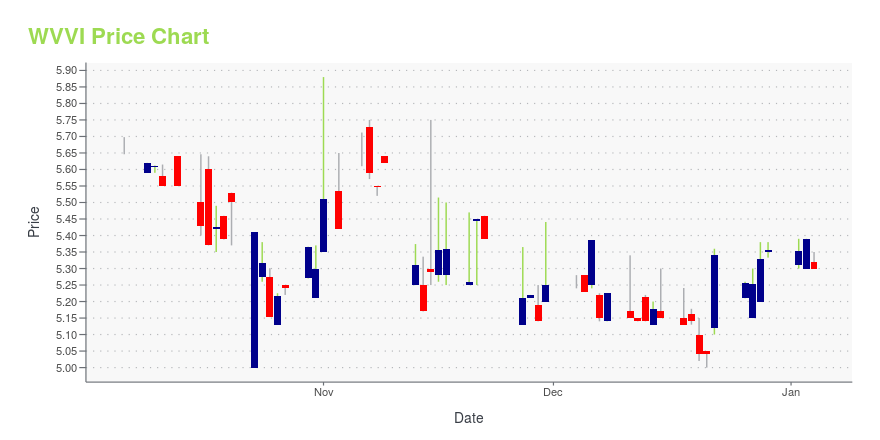
WVVI Stock Price Chart Interactive Chart >
Latest WVVI News From Around the Web
Below are the latest news stories about WILLAMETTE VALLEY VINEYARDS INC that investors may wish to consider to help them evaluate WVVI as an investment opportunity.
Willamette Valley Vineyards Posts results for Q3 2023Willamette Valley Vineyards, Inc. (NASDAQ: WVVI) (the "Company"), a leading Oregon producer of Pinot Noir, generated a loss per common share after preferred dividends of $0.17 and $0.29 for the three months ended September 30, 2023 and 2022 respectively, a decrease of $0.12, for the three month period ended September 30, 2023 over the same three month period in the prior year. |
Willamette Valley Vineyards Announces Annual Cash Dividend for Series A Redeemable Preferred StockWillamette Valley Vineyards, Inc. (NASDAQ:WVVI), a leading Oregon producer of Pinot Noir, declared a cash dividend of $0.22 per share on its Series A Redeemable Preferred stock (NASDAQ:WVVIP) (the "Preferred Stock"), payable on December 29, 2023, to shareholders of record of the Preferred Stock at the close of business on December 7, 2023. Future dividends on the Preferred Stock will be subject to approval by the Willamette Valley Vineyards Inc. board of directors, and the amount of all dividend |
Willamette Valley Vineyards Posts results for Q2 2023Willamette Valley Vineyards, Inc. (NASDAQ:WVVI) (the "Company"), a leading Oregon producer of Pinot Noir, generated a loss per common share after preferred dividends of $0.08 and $0.04 for the three months ended June 30, 2023 and 2022 respectively, an increase of $0.04, for the three month period ended June 30, 2023 over the same three month period in the prior year. |
Willamette Valley Vineyards becomes latest, and biggest, winery to sue PacifiCorp over 2020 wildfire smokeWillamette Valley Vineyards claims economic and property damages of at least $2.7 million, which could be trebled to more than $8.1 million under Oregon law. |
Wine: Good For Your Health, Good For Your Stock Portfolio?If you are looking to invest in the wine and vineyard industry, there are a few stocks to choose from. |
WVVI Price Returns
| 1-mo | -10.41% |
| 3-mo | -16.48% |
| 6-mo | -28.57% |
| 1-year | -39.81% |
| 3-year | -71.38% |
| 5-year | -46.61% |
| YTD | -30.94% |
| 2023 | -10.22% |
| 2022 | -31.10% |
| 2021 | 35.95% |
| 2020 | -8.08% |
| 2019 | 0.58% |
Continue Researching WVVI
Want to do more research on Willamette Valley Vineyards Inc's stock and its price? Try the links below:Willamette Valley Vineyards Inc (WVVI) Stock Price | Nasdaq
Willamette Valley Vineyards Inc (WVVI) Stock Quote, History and News - Yahoo Finance
Willamette Valley Vineyards Inc (WVVI) Stock Price and Basic Information | MarketWatch
Loading social stream, please wait...