Xenetic Biosciences, Inc. (XBIO): Price and Financial Metrics

Xenetic Biosciences, Inc. (XBIO): $5.65

0.05 (-0.88%)

POWR Rating

Component Grades

Momentum

D

Stability

D

Sentiment

Quality

C

Add XBIO to Watchlist
Sign Up

Industry: Biotech

Industry

NR

Ranked

#230 of 468

in industry

XBIO Price/Volume Stats

Current price $5.65 52-week high $7.50
Prev. close $5.70 52-week low $2.40
Day low $5.64 Volume 4,589
Day high $5.76 Avg. volume 16,304
50-day MA $4.26 Dividend yield N/A
200-day MA $4.17 Market Cap 8.66M

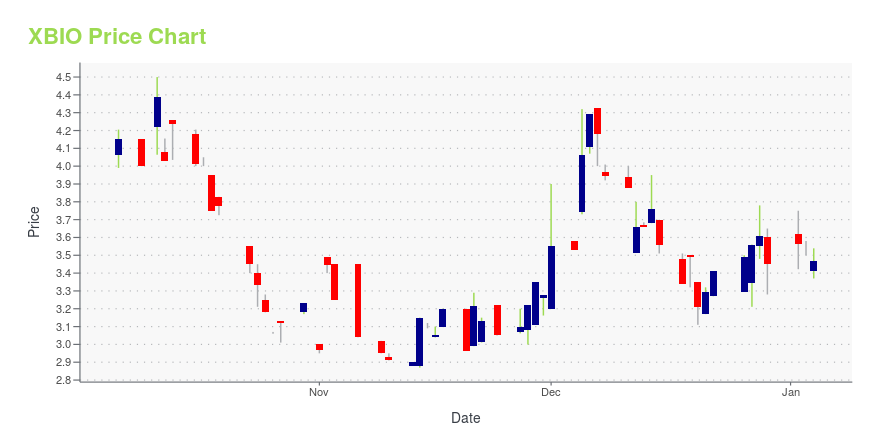
XBIO Stock Price Chart Interactive Chart >

XBIO Stock Summary

  • XBIO has a market capitalization of $8,705,168 -- more than approximately merely 5.29% of US stocks.
  • For XBIO, its debt to operating expenses ratio is greater than that reported by just 0.33% of US equities we're observing.
  • The volatility of XENETIC BIOSCIENCES INC's share price is greater than that of 96.96% US stocks with at least 200 days of trading history.
  • Stocks with similar financial metrics, market capitalization, and price volatility to XENETIC BIOSCIENCES INC are HCWB, FKWL, KLIC, AEIS, and TVTX.
  • Visit XBIO's SEC page to see the company's official filings. To visit the company's web site, go to www.xeneticbio.com.

XBIO Valuation Summary

  • In comparison to the median Healthcare stock, XBIO's price/sales ratio is 110.53% higher, now standing at 4.
  • Over the past 88 months, XBIO's price/earnings ratio has gone up 1.4.

Below are key valuation metrics over time for XBIO.

Stock Date P/S P/B P/E EV/EBIT
XBIO 2023-09-22 4.0 0.7 -2.1 0.5
XBIO 2023-09-21 4.2 0.8 -2.1 0.4
XBIO 2023-09-20 4.0 0.7 -2.1 0.5
XBIO 2023-09-19 4.0 0.7 -2.1 0.5
XBIO 2023-09-18 3.9 0.7 -2.0 0.5
XBIO 2023-09-15 3.7 0.7 -1.9 0.6

XBIO Growth Metrics

    Its 5 year revenue growth rate is now at -97.54%.
  • Its year over year net cashflow from operations growth rate is now at -10.88%.
  • The 3 year price growth rate now stands at -95.47%.
Over the past 15 months, XBIO's revenue has gone up $806,472.

The table below shows XBIO's growth in key financial areas (numbers in millions of US dollars).

Date Revenue Operating Cash Flow Net Income to Common Stock
2022-09-30 1.552557 -5.354557 -6.911498
2022-06-30 1.487576 -5.308659 -7.458357
2022-03-31 1.358469 -5.30657 -5.892845
2021-12-31 1.160692 -4.738067 -5.645179
2021-09-30 0.97942 -4.233028 -5.003524
2021-06-30 0.746085 -4.211731 -11.21302

XBIO's Quality Factors

The “Quality” component of the POWR Ratings focuses on 31 different factors of a companies fundamentals and operational strength. Here are some key insights as we drill into the specifics of these quality attributes.
  • XBIO has a Quality Grade of C, ranking ahead of 27.04% of graded US stocks.
  • XBIO's asset turnover comes in at 0.067 -- ranking 297th of 682 Pharmaceutical Products stocks.
  • ARDX, BPTH, and ASLN are the stocks whose asset turnover ratios are most correlated with XBIO.

The table below shows XBIO's key quality metrics over time.

Period Asset Turnover Gross Margin ROIC
2021-06-30 0.067 1 -17.669
2021-03-31 0.043 1 -16.021
2020-12-31 0.028 1 -18.158
2020-09-30 0.017 1 -19.355
2020-06-30 0.009 1 -25.896
2020-03-31 0.004 1 -75.015

XBIO Price Target

For more insight on analysts targets of XBIO, see our XBIO price target page. And for a list of of all stocks sorted by upside potential based on analyst target price, see our Top Price Target page.

Average Price Target $5.00 Average Broker Recommendation 1.5 (Moderate Buy)

Xenetic Biosciences, Inc. (XBIO) Company Bio


Xenetic Biosciences, Inc. operates as a biopharmaceutical company. The Company focuses on progressing XCART, a personalized CAR T platform technology engineered to target patient-specific tumor neoantigens, as well as offers cell-based therapeutics targeting the B-cell receptor on the surface of malignant tumor cells. Xenetic Biosciences serves patients in the United States.


XBIO Latest News Stream


Event/Time News Detail
Loading, please wait...

XBIO Latest Social Stream


Loading social stream, please wait...

View Full XBIO Social Stream

Latest XBIO News From Around the Web

Below are the latest news stories about XENETIC BIOSCIENCES INC that investors may wish to consider to help them evaluate XBIO as an investment opportunity.

Xenetic Biosciences, Inc. to Present at the H.C. Wainwright 25th Annual Global Investment Conference

Xenetic Biosciences, Inc. (NASDAQ:XBIO) ("Xenetic" or the "Company"), a biopharmaceutical company focused on advancing innovative immune-oncology technologies addressing hard to treat cancers, today announced that Jeffrey Eisenberg, Chief Executive Officer of Xenetic will present at the H.C. Wainwright 25th Annual Global Investment Conference being held September 11-13, 2023 in New York, NY and virtually.

Yahoo | September 5, 2023

Xenetic Biosciences (XBIO) Reports Q2 Loss, Tops Revenue Estimates

Xenetic Biosciences (XBIO) delivered earnings and revenue surprises of 38.94% and 47.96%, respectively, for the quarter ended June 2023. Do the numbers hold clues to what lies ahead for the stock?

Yahoo | August 11, 2023

Xenetic Biosciences, Inc. Reports Second Quarter 2023 Financial Results

Xenetic Biosciences, Inc. (NASDAQ:XBIO) ("Xenetic" or the "Company"), a biopharmaceutical company focused on advancing innovative immune-oncology technologies addressing hard to treat cancers, today reported its financial results for the second quarter of 2023.

Yahoo | August 11, 2023

Oncternal Therapeutics (ONCT) Reports Q2 Loss, Lags Revenue Estimates

Oncternal Therapeutics (ONCT) delivered earnings and revenue surprises of 11.76% and 49.52%, respectively, for the quarter ended June 2023. Do the numbers hold clues to what lies ahead for the stock?

Yahoo | August 10, 2023

Xenetic Biosciences (XBIO) Upgraded to Strong Buy: What Does It Mean for the Stock?

Xenetic Biosciences (XBIO) might move higher on growing optimism about its earnings prospects, which is reflected by its upgrade to a Zacks Rank #1 (Strong Buy).

Yahoo | July 13, 2023

Read More 'XBIO' Stories Here

XBIO Price Returns

1-mo 44.50%
3-mo 84.04%
6-mo 39.16%
1-year 6.60%
3-year -37.91%
5-year -98.34%
YTD 98.18%
2022 -77.90%
2021 -36.76%
2020 41.67%
2019 -92.68%
2018 -14.58%

Get Free Updates

Join thousands of investors who get the latest news, insights and top rated picks from StockNews.com!