
XBiotech Inc. (XBIT): Price and Financial Metrics
XBIT Price/Volume Stats
| Current price | $7.87 | 52-week high | $9.96 |
| Prev. close | $8.21 | 52-week low | $3.05 |
| Day low | $7.70 | Volume | 59,300 |
| Day high | $8.34 | Avg. volume | 62,454 |
| 50-day MA | $7.44 | Dividend yield | N/A |
| 200-day MA | $5.25 | Market Cap | 239.65M |
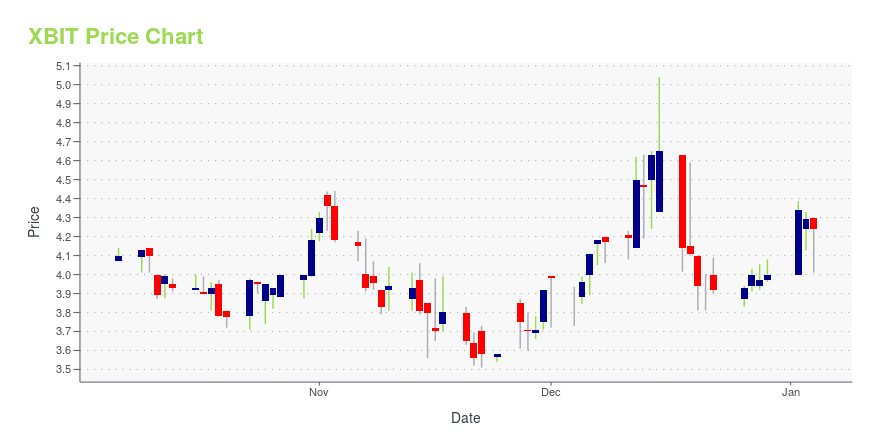
XBIT Stock Price Chart Interactive Chart >
XBiotech Inc. (XBIT) Company Bio
XBiotech Inc. is a clinical-stage biopharmaceutical company, engages in discovering and developing True Human monoclonal antibodies for treating various different diseases. The company was founded in 2005 and is based in Austin, Texas.
Latest XBIT News From Around the Web
Below are the latest news stories about XBIOTECH INC that investors may wish to consider to help them evaluate XBIT as an investment opportunity.
Companies Like XBiotech (NASDAQ:XBIT) Are In A Position To Invest In GrowthWe can readily understand why investors are attracted to unprofitable companies. For example, biotech and mining... |
Dr. Alan Kivitz to Chair XBiotech’s Natrunix Program in Rheumatoid Arthritis(Phase II Multicenter Study is Proceeding Well with High Anticipation)AUSTIN, Texas, Nov. 14, 2023 (GLOBE NEWSWIRE) -- XBiotech (NASDAQ: XBIT) today announced that Alan Kivitz M.D. is now Lead Investigator & Study Chairman for its clinical research program for Natrunix in Rheumatoid Arthritis. XBiotech believes Natrunix will be a breakthrough therapy for rheumatological diseases. The company has now enrolled about 33% of the 210 patients it is recruiting for a Phase II, Double-Blind, Placebo-Con |
XBiotech Announces Enrollment Completion of Phase I Clinical Trial for Hutrukin, a Novel Candidate Therapy for StrokeAUSTIN, Texas, Sept. 26, 2023 (GLOBE NEWSWIRE) -- XBiotech Inc. (NASDAQ: XBIT) Announces that Hutrukin is being developed by XBiotech as a breakthrough therapy to reduce brain injury after stroke. The last subject in a randomized, open-label, placebo-controlled Phase I dose escalation clinical study has been enrolled. XBiotech discovered, manufactures, and is conducting this clinical study of Hutrukin. The primary objective of the Phase I study is to evaluate safety and pharmacokinetics of Hutru |
Individual investors account for 50% of XBiotech Inc.'s (NASDAQ:XBIT) ownership, while insiders account for 35%Key Insights The considerable ownership by individual investors in XBiotech indicates that they collectively have a... |
XBiotech Announces Enrollment Completion of Phase II, Placebo Controlled, Multicenter Study for Natrunix in Pancreatic CancerAUSTIN, Texas, Aug. 30, 2023 (GLOBE NEWSWIRE) -- XBiotech Inc. announced today completion of enrollment of the Phase II portion of its 1-BETTER study—a Phase I/II randomized, double-blind, placebo-controlled clinical study for Natrunix in combination with chemotherapy for treating pancreatic cancer. Natrunix is indistinguishable from a naturally occurring antibody present in a healthy human. Natrunix binds and neutralizes a potent substance, a so called cytokine known as interleukin-1a (IL-1a), |
XBIT Price Returns
| 1-mo | -3.20% |
| 3-mo | 87.38% |
| 6-mo | 96.75% |
| 1-year | 128.78% |
| 3-year | -55.89% |
| 5-year | -16.54% |
| YTD | 96.75% |
| 2023 | 13.96% |
| 2022 | -68.46% |
| 2021 | -28.88% |
| 2020 | -16.15% |
| 2019 | 267.42% |
Loading social stream, please wait...