Exela Technologies, Inc. (XELA): Price and Financial Metrics
XELA Price/Volume Stats
| Current price | $2.50 | 52-week high | $6.59 |
| Prev. close | $2.40 | 52-week low | $1.83 |
| Day low | $2.42 | Volume | 41,186 |
| Day high | $2.53 | Avg. volume | 184,738 |
| 50-day MA | $2.42 | Dividend yield | N/A |
| 200-day MA | $2.65 | Market Cap | 15.91M |
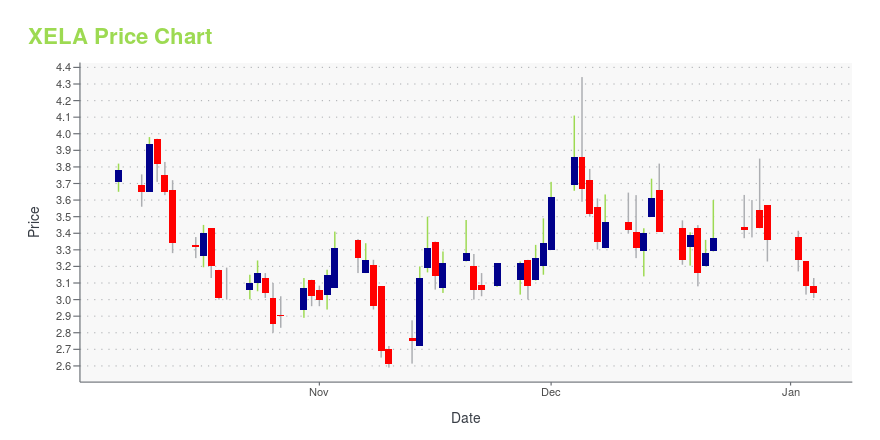
XELA Stock Price Chart Interactive Chart >
Exela Technologies, Inc. (XELA) Company Bio
Exela Technologies, Inc. (Exela), formerly Quinpario Acquisition Corp. 2, is engaged in providing information and transaction processing solutions. The Company’s segments include Information and Transaction Processing Solutions (ITPS), Healthcare Solutions (HS) and Legal & Loss Prevention Services (LLPS). ITPS provides industry solutions for banking and financial services, including lending solutions for mortgages, banking solutions for clearing, anti-money laundering, sanctions, cross-border settlement; property and casualty insurance solutions for enrollments, and communications. The HS segment offerings include integrated accounts payable and accounts receivable, and information management for both the healthcare payer and provider markets. The LLPS segment solutions include processing of legal claims for class action and mass action settlement administrations, involving project management support, notification and collection, analysis, and distribution of settlement funds. The company is based in Irving, Texas.
Latest XELA News From Around the Web
Below are the latest news stories about EXELA TECHNOLOGIES INC that investors may wish to consider to help them evaluate XELA as an investment opportunity.
Exela Technologies Reminds Stockholders to Cast Their Vote for Upcoming Annual Meeting of Stockholders to be held on December 29, 2023 at 10:00 a.m. Eastern TimeIRVING, Texas, Dec. 22, 2023 (GLOBE NEWSWIRE) -- Exela Technologies, Inc. (“Exela” or the “Company”) (NASDAQ: XELA, XELAP), a business process automation leader, today reminds its stockholders to vote ahead of the upcoming annual meeting of stockholders (the "Meeting"). The Meeting will be held online at www.virtualshareholdermeeting.com/XELA2023 on Friday, December 29, 2023 at 10:00 AM ET/9:00 a.m. CT. The Board of Directors of Exela unanimously recommends that the Company's stockholders vote " |
Exela Technologies Recognized as Emerging Solution in FAO Hackett Value Matrix™IRVING, Texas, Dec. 13, 2023 (GLOBE NEWSWIRE) -- Exela Technologies, Inc. (“Exela” or the “Company”) (NASDAQ: XELA, XELAP), a global business process automation (“BPA”) leader, announced that the Company has been recognized as an Emerging Solution Provider in the Hackett Value Matrix™ for Finance and Accounting Outsourcing Solution Providers (“FAO”). The Hackett Excelleration Matrix™ evaluates providers’ differentiated capabilities and also assesses the value that organizations can expect soluti |
Exela Technologies Named in Forrester’s ‘The Accounts Payable Invoice Automation Landscape, Q1 2024 Report’IRVING, Texas, Dec. 11, 2023 (GLOBE NEWSWIRE) -- Exela Technologies, Inc. (“Exela” or the “Company”) (NASDAQ: XELA, XELAP), a global business process automation (“BPA”) leader, announced today that the Company has been included in the Forrester's ‘Accounts Payable Invoice Automation Landscape, Q4 2023 report’. In an overview of 33 notable vendors, this comprehensive report focuses on how accounts payable invoice automation (APIA) can streamline the capture of invoice data, automate key steps in |
Exela Technologies Announces Adjournment of Annual MeetingIRVING, Texas, Dec. 05, 2023 (GLOBE NEWSWIRE) -- Exela Technologies, Inc. (“Exela” or the “Company”) (NASDAQ: XELA; XELAP), a business process automation leader, today announced that it adjourned the Annual Meeting of Stockholders held on December 5, 2023 (the "Meeting"). The Meeting will reconvene on Friday, December 29, 2023 at 10:00 AM ET/9:00 a.m. Central Time. Due to lack of required quorum, the Meeting was adjourned, without any business being conducted, to allow additional time for the Co |
Exela Reminds Stockholders of Upcoming Annual Meeting and Encourages VotingIRVING, Texas, Dec. 01, 2023 (GLOBE NEWSWIRE) -- Exela Technologies, Inc. (“Exela” or the “Company”) (NASDAQ: XELA, XELAP) a business process automation leader, today reminds stockholders of its upcoming Annual Meeting of Stockholders (the "Meeting"). The Meeting will be held online at www.virtualshareholdermeeting.com/XELA2023 on Tuesday, December 5, 2023 at 10:00 a.m. Eastern Time/ 9:00 a.m. Central Time. The Company urges all stockholders to exercise their right to vote their shares by proxy |
XELA Price Returns
| 1-mo | 10.13% |
| 3-mo | 23.76% |
| 6-mo | 6.38% |
| 1-year | -59.15% |
| 3-year | -99.98% |
| 5-year | -99.99% |
| YTD | -25.60% |
| 2023 | -79.51% |
| 2022 | -99.53% |
| 2021 | -29.58% |
| 2020 | 1.86% |
| 2019 | -89.52% |
Continue Researching XELA
Here are a few links from around the web to help you further your research on Exela Technologies Inc's stock as an investment opportunity:Exela Technologies Inc (XELA) Stock Price | Nasdaq
Exela Technologies Inc (XELA) Stock Quote, History and News - Yahoo Finance
Exela Technologies Inc (XELA) Stock Price and Basic Information | MarketWatch


Loading social stream, please wait...