
Xenon Pharmaceuticals Inc. (XENE): Price and Financial Metrics
XENE Price/Volume Stats
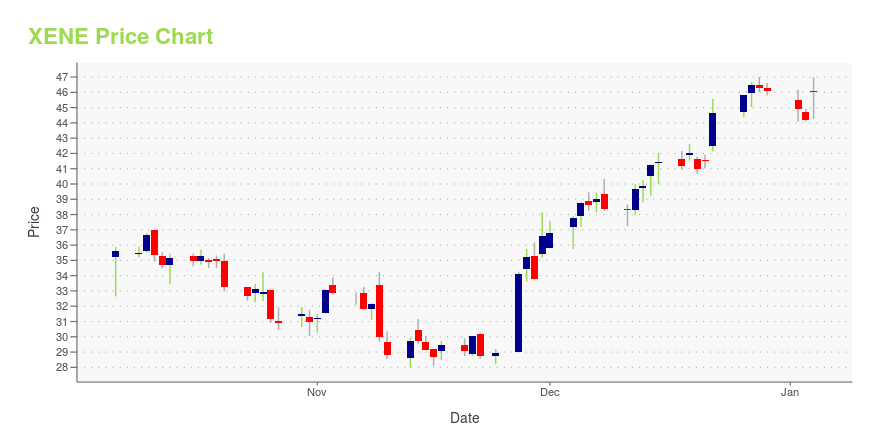
| Current price | $43.96 | 52-week high | $50.99 |
| Prev. close | $43.85 | 52-week low | $27.99 |
| Day low | $43.45 | Volume | 275,400 |
| Day high | $44.44 | Avg. volume | 407,310 |
| 50-day MA | $39.23 | Dividend yield | N/A |
| 200-day MA | $40.60 | Market Cap | 3.32B |
XENE Stock Price Chart Interactive Chart >
Xenon Pharmaceuticals Inc. (XENE) Company Bio
Xenon Pharmaceuticals Inc., a clinical-stage biopharmaceutical company, engages in discovering and developing differentiated therapeutics for orphan indications in Canada. The company was founded in 1996 and is based in Burnaby, Canada.
Latest XENE News From Around the Web
Below are the latest news stories about XENON PHARMACEUTICALS INC that investors may wish to consider to help them evaluate XENE as an investment opportunity.
Xenon Pharmaceuticals Announces Closing of $345.0 Million Upsized Public Offering Including Full Exercise of the Underwriters’ Option to Purchase Additional SharesVANCOUVER, British Columbia, Dec. 04, 2023 (GLOBE NEWSWIRE) -- Xenon Pharmaceuticals Inc. (Nasdaq:XENE), a neurology-focused biopharmaceutical company, today announced the closing of its previously announced underwritten public offering of 9,846,157 common shares, which includes 1,384,615 shares sold upon the full exercise of the underwriters’ option to purchase additional shares, and pre-funded warrants to purchase up to 769,230 common shares. The common shares were offered at a public offering |
After losing 5.2% in the past year, Xenon Pharmaceuticals Inc. (NASDAQ:XENE) institutional owners must be relieved by the recent gainKey Insights Significantly high institutional ownership implies Xenon Pharmaceuticals' stock price is sensitive to... |
Xenon Pharmaceuticals Provides Updates on Neurology Pipeline Programs at the Annual Meeting of the American Epilepsy Society (AES 2023)VANCOUVER, British Columbia, Dec. 02, 2023 (GLOBE NEWSWIRE) -- Xenon Pharmaceuticals Inc. (Nasdaq:XENE), a neurology-focused biopharmaceutical company, today announced it will provide updates on its neurology programs at the Annual Meeting of the American Epilepsy Society (AES 2023). Mr. Ian Mortimer, Xenon’s President and Chief Executive Officer, stated, “Xenon will have another strong presence at AES this year, with many presentations and activities aimed at raising awareness about our XEN1101 |
Xenon Pharmaceuticals Announces Pricing of Upsized $300.0 Million Public OfferingVANCOUVER, British Columbia, Nov. 29, 2023 (GLOBE NEWSWIRE) -- Xenon Pharmaceuticals Inc. (Nasdaq:XENE) (“Xenon”), a neurology-focused biopharmaceutical company, today announced the pricing of its upsized underwritten public offering of 8,461,542 common shares and, in lieu of common shares to certain investors, pre-funded warrants to purchase up to 769,230 common shares pursuant to its existing shelf registration statement. The common shares are being offered at a public offering price of $32.50 |
Xenon Pharmaceuticals Announces Proposed Public OfferingVANCOUVER, British Columbia, Nov. 29, 2023 (GLOBE NEWSWIRE) -- Xenon Pharmaceuticals Inc. (Nasdaq:XENE) (“Xenon”), a neurology-focused biopharmaceutical company, today announced that it has commenced an underwritten public offering of $225.0 million of its common shares and, in lieu of common shares to certain investors that so choose, pre-funded warrants to purchase common shares, pursuant to its existing shelf registration statement. All of the common shares and pre-funded warrants in this off |
XENE Price Returns
| 1-mo | 20.21% |
| 3-mo | 8.54% |
| 6-mo | -3.68% |
| 1-year | 22.69% |
| 3-year | 145.86% |
| 5-year | 357.92% |
| YTD | -4.56% |
| 2023 | 16.81% |
| 2022 | 26.22% |
| 2021 | 103.12% |
| 2020 | 17.32% |
| 2019 | 107.77% |
Loading social stream, please wait...