Xencor, Inc. (XNCR): Price and Financial Metrics

Xencor, Inc. (XNCR): $26.94

-0.04 (-0.15%)

POWR Rating

Component Grades

Momentum

C

Stability

C

Sentiment

Quality

C

Add XNCR to Watchlist
Sign Up

Industry: Biotech

Industry

F

Ranked

#254 of 382

in industry

XNCR Price/Volume Stats
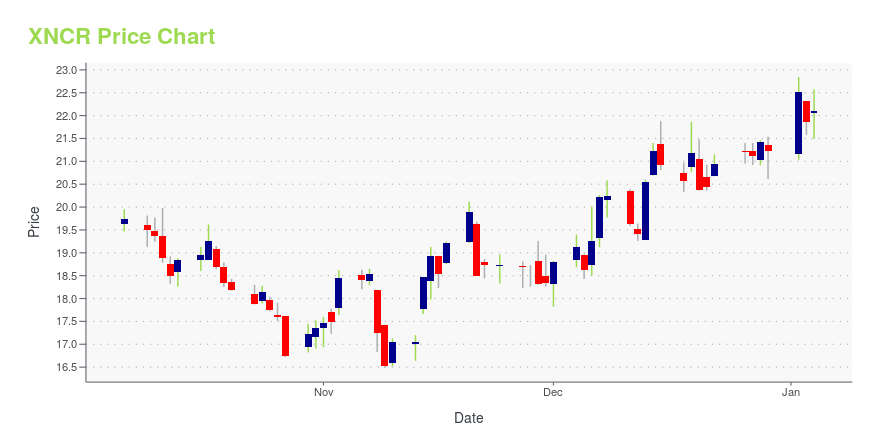
Current price $26.94 52-week high $38.20
Prev. close $26.98 52-week low $19.35
Day low $26.70 Volume 54,537
Day high $27.26 Avg. volume 338,994
50-day MA $27.61 Dividend yield N/A
200-day MA $28.61 Market Cap 1.63B

XNCR Stock Price Chart Interactive Chart >

XNCR POWR Grades

  • Value is the dimension where XNCR ranks best; there it ranks ahead of 42.21% of US stocks.
  • The strongest trend for XNCR is in Value, which has been heading down over the past 179 days.
  • XNCR ranks lowest in Sentiment; there it ranks in the 8th percentile.

XNCR Stock Summary

  • XNCR's price/sales ratio is 17.1; that's higher than the P/S ratio of 93.5% of US stocks.
  • In terms of twelve month growth in earnings before interest and taxes, XENCOR INC is reporting a growth rate of -227.74%; that's higher than merely 7.28% of US stocks.
  • Revenue growth over the past 12 months for XENCOR INC comes in at -69.98%, a number that bests only 3.12% of the US stocks we're tracking.
  • If you're looking for stocks that are quantitatively similar to XENCOR INC, a group of peers worth examining would be IGMS, DNLI, NTLA, BEAM, and ARVN.
  • XNCR's SEC filings can be seen here. And to visit XENCOR INC's official web site, go to www.xencor.com.

XNCR Valuation Summary

  • In comparison to the median Healthcare stock, XNCR's price/sales ratio is 247.06% higher, now standing at 17.7.
  • Over the past 115 months, XNCR's price/sales ratio has gone down 4.9.

Below are key valuation metrics over time for XNCR.

Stock Date P/S P/B P/E EV/EBIT
XNCR 2023-05-23 17.7 2.5 -12.4 -12.4
XNCR 2023-05-22 17.1 2.5 -12.0 -12.0
XNCR 2023-05-19 16.9 2.4 -11.9 -11.8
XNCR 2023-05-18 16.0 2.3 -11.3 -11.2
XNCR 2023-05-17 16.3 2.3 -11.5 -11.4
XNCR 2023-05-16 16.4 2.3 -11.5 -11.5

XNCR Growth Metrics

    The 2 year cash and equivalents growth rate now stands at 6.04%.
  • The 2 year revenue growth rate now stands at 323.4%.
  • The 4 year revenue growth rate now stands at -8.82%.
XNCR's revenue has moved up $212,376,000 over the prior 67 months.

The table below shows XNCR's growth in key financial areas (numbers in millions of US dollars).

Date Revenue Operating Cash Flow Net Income to Common Stock
2022-09-30 296.984 110.706 29.921
2022-06-30 289.368 72.851 22.489
2022-03-31 326.64 18.928 108.712
2021-12-31 275.111 -16.853 82.631
2021-09-30 162.949 -61.559 -4.121
2021-06-30 178.632 -26.402 23.52

XNCR's Quality Factors

The “Quality” component of the POWR Ratings focuses on 31 different factors of a companies fundamentals and operational strength. Here are some key insights as we drill into the specifics of these quality attributes.
  • XNCR has a Quality Grade of D, ranking ahead of 9.2% of graded US stocks.
  • XNCR's asset turnover comes in at 0.261 -- ranking 167th of 682 Pharmaceutical Products stocks.
  • PTGX, MDWD, and ALBO are the stocks whose asset turnover ratios are most correlated with XNCR.

The table below shows XNCR's key quality metrics over time.

Period Asset Turnover Gross Margin ROIC
2021-06-30 0.261 1 0.051
2021-03-31 0.185 1 -0.142
2020-12-31 0.184 1 -0.145
2020-09-30 0.128 1 -0.162
2020-06-30 0.106 1 -0.154
2020-03-31 0.114 1 -0.111

XNCR Price Target

For more insight on analysts targets of XNCR, see our XNCR price target page. And for a list of of all stocks sorted by upside potential based on analyst target price, see our Top Price Target page.

Average Price Target $53.55 Average Broker Recommendation 1.41 (Moderate Buy)

Xencor, Inc. (XNCR) Company Bio


Xencor Inc. is a clinical-stage biopharmaceutical company developing engineered monoclonal antibodies for the treatment of asthma and allergic diseases, autoimmune diseases and cancer. The company was founded in 1997 and is based in Monrovia, California.


XNCR Latest News Stream


Event/Time News Detail
Loading, please wait...

XNCR Latest Social Stream


Loading social stream, please wait...

View Full XNCR Social Stream

Latest XNCR News From Around the Web

Below are the latest news stories about XENCOR INC that investors may wish to consider to help them evaluate XNCR as an investment opportunity.

Xencor Presents Clinical Results from Phase 1a Study of XmAb®564 at the EULAR 2023 Congress

PASADENA, Calif., May 30, 2023--Xencor, Inc. (NASDAQ:XNCR), a clinical-stage biopharmaceutical company developing engineered antibodies and cytokines for the treatment of patients with cancer and autoimmune diseases, today announced the presentation of results from its Phase 1a single-ascending dose study of XmAb®564 in healthy volunteers. XmAb564 is a potency-tuned IL-2-Fc fusion protein, engineered to selectively activate and expand regulatory T cells (Tregs) for the potential treatment of pat

Yahoo | May 30, 2023

Q1 2023 Xencor Inc Earnings Call

Q1 2023 Xencor Inc Earnings Call

Yahoo | May 9, 2023

Xencor (XNCR) Reports Q1 Loss, Tops Revenue Estimates

Xencor (XNCR) delivered earnings and revenue surprises of -36% and 1.10%, respectively, for the quarter ended March 2023. Do the numbers hold clues to what lies ahead for the stock?

Yahoo | May 8, 2023

Xencor Reports First Quarter 2023 Financial Results

PASADENA, Calif., May 08, 2023--Xencor, Inc. (NASDAQ:XNCR), a clinical-stage biopharmaceutical company developing engineered antibodies and cytokines for the treatment of patients with cancer and autoimmune diseases, today reported financial results for the first quarter ended March 31, 2023 and provided a review of recent business and clinical highlights.

Yahoo | May 8, 2023

Xencor to Host First Quarter 2023 Financial Results Webcast and Conference Call on May 8, 2023

PASADENA, Calif., May 01, 2023--Xencor, Inc. (NASDAQ: XNCR), a clinical-stage biopharmaceutical company developing engineered antibodies and cytokines for the treatment of cancer and autoimmune diseases, today announced it will release first quarter 2023 financial results after the market closes on Monday, May 8, 2023.

Yahoo | May 1, 2023

Read More 'XNCR' Stories Here

XNCR Price Returns

1-mo 0.41%
3-mo -0.19%
6-mo -8.02%
1-year 21.19%
3-year -15.47%
5-year -36.48%
YTD 3.46%
2022 -35.09%
2021 -8.04%
2020 26.87%
2019 -4.89%
2018 64.96%

Continue Researching XNCR

Want to see what other sources are saying about Xencor Inc's financials and stock price? Try the links below:

Xencor Inc (XNCR) Stock Price | Nasdaq
Xencor Inc (XNCR) Stock Quote, History and News - Yahoo Finance
Xencor Inc (XNCR) Stock Price and Basic Information | MarketWatch

Get Free Updates

Join thousands of investors who get the latest news, insights and top rated picks from StockNews.com!