
XPO Logistics Inc. (XPO): Price and Financial Metrics
XPO Price/Volume Stats
| Current price | $109.70 | 52-week high | $130.51 |
| Prev. close | $114.90 | 52-week low | $64.70 |
| Day low | $106.33 | Volume | 2,451,267 |
| Day high | $114.15 | Avg. volume | 1,472,010 |
| 50-day MA | $107.57 | Dividend yield | N/A |
| 200-day MA | $101.75 | Market Cap | 12.76B |
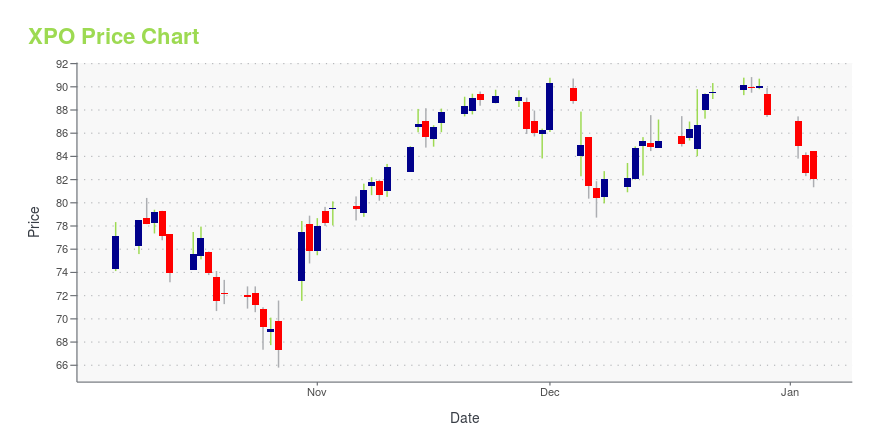
XPO Stock Price Chart Interactive Chart >
XPO Logistics Inc. (XPO) Company Bio
XPO Logistics is an American freight transportation company that provides less-than-truckload and truck brokerage services in 18 countries. XPO's corporate headquarters are located in Greenwich, Connecticut, U.S. (Source:Wikipedia)
Latest XPO News From Around the Web
Below are the latest news stories about XPO INC that investors may wish to consider to help them evaluate XPO as an investment opportunity.
XPO Named One of “America’s Greatest Workplaces for Diversity for 2024” by NewsweekGREENWICH, Conn. , Dec. 15, 2023 (GLOBE NEWSWIRE) -- XPO (NYSE: XPO), a leading provider of freight transportation in North America, has been named one of “America’s Greatest Workplaces for Diversity for 2024” by Newsweek magazine. XPO received this honor for respecting and valuing “individuals from different walks of life” and the role that diversity plays in driving creativity, innovation and organizational success. Carolyn Roach, chief human resources officer at XPO said, “At XPO, we strive t |
XPO Gained from Rival’s Bankruptcy Filing in Q3ClearBridge Investments, an investment management firm, released its third-quarter 2023 “Mid Cap Growth Strategy” investor letter, a copy of which can be downloaded here. The strategy underperformed its benchmark Russell Midcap Growth Index in the quarter. Overall, the effects of stock selection impacted the performance on a relative basis. The strategy gained three of the 11 […] |
Stocks to Watch Wednesday: Tesla, Pfizer, Take-Two, Adobe[**Tesla (TSLA)**](https://www.wsj.com/market-data/quotes/TSLA): The electric vehicle maker will offer software updates for more than two million vehicles [over concerns about its Autopilot system, after a two-year probe by U. |
XPO ready to deploy 28 new service centersXPO said Tuesday it’s excited about a “once-in-a-generation” terminal acquisition that will facilitate the next decade of growth. The post XPO ready to deploy 28 new service centers appeared first on FreightWaves. |
XPO Approved to Acquire 28 Service Centers as Part of Yellow’s Chapter 11 BankruptcyGREENWICH, Conn., Dec. 12, 2023 (GLOBE NEWSWIRE) -- XPO (NYSE: XPO), a leading provider of LTL freight transportation in North America, today announced that the United States Bankruptcy Court for the District of Delaware has approved the company’s offer to acquire 28 service center locations previously operated by Yellow Corporation. XPO will purchase 26 service centers and assume existing leases for the other two locations. The transaction is expected to close by the end of 2023. Mario Harik, c |
XPO Price Returns
| 1-mo | 4.43% |
| 3-mo | -1.08% |
| 6-mo | 26.25% |
| 1-year | 55.45% |
| 3-year | 130.98% |
| 5-year | 377.82% |
| YTD | 25.24% |
| 2023 | 163.11% |
| 2022 | -26.91% |
| 2021 | 11.73% |
| 2020 | 49.56% |
| 2019 | 39.73% |
Continue Researching XPO
Want to see what other sources are saying about XPO Logistics Inc's financials and stock price? Try the links below:XPO Logistics Inc (XPO) Stock Price | Nasdaq
XPO Logistics Inc (XPO) Stock Quote, History and News - Yahoo Finance
XPO Logistics Inc (XPO) Stock Price and Basic Information | MarketWatch
Loading social stream, please wait...