Xylem Inc. (XYL): Price and Financial Metrics
XYL Price/Volume Stats
Current price | $129.38 | 52-week high | $130.86 |
Prev. close | $127.90 | 52-week low | $87.59 |
Day low | $128.10 | Volume | 959,600 |
Day high | $129.45 | Avg. volume | 1,184,553 |
50-day MA | $122.40 | Dividend yield | 1.11% |
200-day MA | $107.96 | Market Cap | 31.28B |
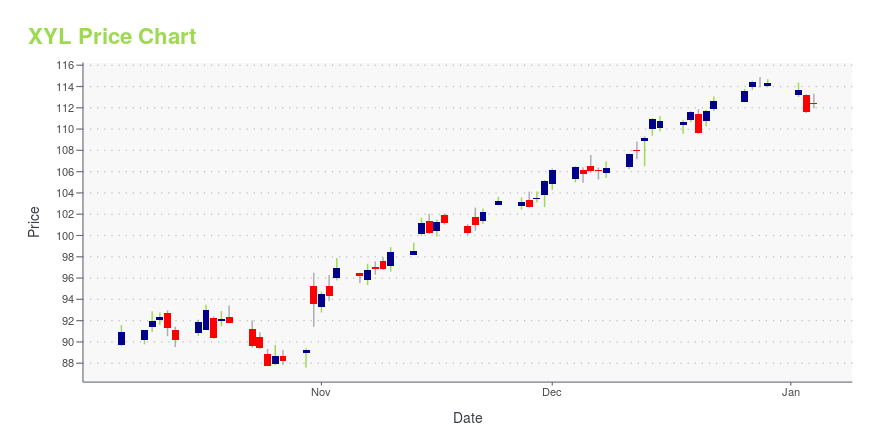
XYL Stock Price Chart Interactive Chart >
XYL POWR Grades
- Momentum is the dimension where XYL ranks best; there it ranks ahead of 78.23% of US stocks.
- XYL's strongest trending metric is Growth; it's been moving down over the last 26 weeks.
- XYL ranks lowest in Value; there it ranks in the 11th percentile.
XYL Stock Summary
- XYL has a higher market value than 91.21% of US stocks; more precisely, its current market capitalization is $26,894,637,137.
- With a price/earnings ratio of 54.66, XYLEM INC P/E ratio is greater than that of about 87.47% of stocks in our set with positive earnings.
- Price to trailing twelve month operating cash flow for XYL is currently 36.15, higher than 89.57% of US stocks with positive operating cash flow.
- If you're looking for stocks that are quantitatively similar to XYLEM INC, a group of peers worth examining would be FTV, PNR, HUN, TFX, and OC.
- Visit XYL's SEC page to see the company's official filings. To visit the company's web site, go to www.xylem.com.
XYL Valuation Summary
- XYL's price/sales ratio is 4.1; this is 241.67% higher than that of the median Industrials stock.
- Over the past 149 months, XYL's EV/EBIT ratio has gone up 32.8.
Below are key valuation metrics over time for XYL.
Stock | Date | P/S | P/B | P/E | EV/EBIT |
---|---|---|---|---|---|
XYL | 2023-12-29 | 4.1 | 2.8 | 56.0 | 44.0 |
XYL | 2023-12-28 | 4.1 | 2.8 | 56.0 | 44.0 |
XYL | 2023-12-27 | 4.1 | 2.8 | 56.0 | 44.0 |
XYL | 2023-12-26 | 4.1 | 2.8 | 55.7 | 43.7 |
XYL | 2023-12-22 | 4.0 | 2.7 | 55.2 | 43.4 |
XYL | 2023-12-21 | 4.0 | 2.7 | 54.7 | 43.0 |
XYL Growth Metrics
- The 2 year net income to common stockholders growth rate now stands at 17.22%.
- Its 2 year price growth rate is now at 38.82%.
- Its 3 year revenue growth rate is now at -0.31%.
The table below shows XYL's growth in key financial areas (numbers in millions of US dollars).
Date | Revenue | Operating Cash Flow | Net Income to Common Stock |
---|---|---|---|
2022-09-30 | 5,339 | 454 | 319 |
2022-06-30 | 5,224 | 364 | 421 |
2022-03-31 | 5,211 | 483 | 422 |
2021-12-31 | 5,195 | 538 | 427 |
2021-09-30 | 5,245 | 688 | 462 |
2021-06-30 | 5,200 | 851 | 385 |
XYL's Quality Factors
The “Quality” component of the POWR Ratings focuses on 31 different factors of a companies fundamentals and operational strength. Here are some key insights as we drill into the specifics of these quality attributes.- XYL has a Quality Grade of B, ranking ahead of 80.06% of graded US stocks.
- XYL's asset turnover comes in at 0.613 -- ranking 65th of 104 Machinery stocks.
- IEX, ALG, and SOI are the stocks whose asset turnover ratios are most correlated with XYL.
The table below shows XYL's key quality metrics over time.
Period | Asset Turnover | Gross Margin | ROIC |
---|---|---|---|
2021-09-30 | 0.613 | 0.383 | 0.151 |
2021-06-30 | 0.602 | 0.384 | 0.126 |
2021-03-31 | 0.586 | 0.382 | 0.098 |
2020-12-31 | 0.587 | 0.375 | 0.082 |
2020-09-30 | 0.606 | 0.378 | 0.086 |
2020-06-30 | 0.633 | 0.382 | 0.075 |
XYL Price Target
For more insight on analysts targets of XYL, see our XYL price target page. And for a list of of all stocks sorted by upside potential based on analyst target price, see our Top Price Target page.
Average Price Target | $125.67 | Average Broker Recommendation | 1.91 (Hold) |
Xylem Inc. (XYL) Company Bio
Xylem Inc. is a large American water technology provider, in public utility, residential, commercial, agricultural and industrial settings. The company does business in more than 150 countries. Launched in 2011 as the spinoff of the water-related businesses of ITT Corporation, Xylem is headquartered in Rye Brook, New York, with 2018 revenues of $5.2 billion and 17,000 employees worldwide. (Source:Wikipedia)
Latest XYL News From Around the Web
Below are the latest news stories about XYLEM INC that investors may wish to consider to help them evaluate XYL as an investment opportunity.
Water Wealth: 3 Stocks Tapping into Liquid GoldWhile mining for gold or cryptocurrencies offer a sexier path to profits, at a basic level, nothing beats the permanent narrative underlying water stocks. |
The Zacks Analyst Blog Highlights NVIDIA, Oracle, The TJX Companies, Chubb and XylemNVIDIA, Oracle, The TJX Companies, Chubb and Xylem are part of the Zacks top Analyst Blog . |
Top Stock Reports for NVIDIA, Oracle & The TJX CompaniesToda's Research Daily features new research reports on 16 major stocks, including NVIDIA Corporation (NVDA), Oracle Corporation (ORCL) and The TJX Companies, Inc. (TJX). |
Here's Why Investing in Xylem (XYL) Stock Makes Sense NowXylem (XYL) benefits from strength in the Measurement & Control Solutions segment and the acquisition of Evoqua. Its measures to reward its shareholders are encouraging. |
Manufacturing Activity Poised for Rebound in 2024: 5 PicksStocks like Eaton Corporation (ETN), A. O. Smith Corporation (AOS), Xylem (XYL), Graham Corporation (GHM) and Applied Industrial Technologies (AIT) are poised to benefit from the jump in durable goods orders. |
XYL Price Returns
1-mo | 2.94% |
3-mo | 13.46% |
6-mo | 43.01% |
1-year | 29.13% |
3-year | 28.56% |
5-year | 73.93% |
YTD | 13.46% |
2023 | 4.77% |
2022 | -6.60% |
2021 | 18.94% |
2020 | 30.90% |
2019 | 19.59% |
XYL Dividends
Ex-Dividend Date | Type | Payout Amount | Change | ||||||
---|---|---|---|---|---|---|---|---|---|
Loading, please wait... |
Continue Researching XYL
Want to do more research on Xylem Inc's stock and its price? Try the links below:Xylem Inc (XYL) Stock Price | Nasdaq
Xylem Inc (XYL) Stock Quote, History and News - Yahoo Finance
Xylem Inc (XYL) Stock Price and Basic Information | MarketWatch
Loading social stream, please wait...