Yelp Inc. (YELP): Price and Financial Metrics
YELP Price/Volume Stats
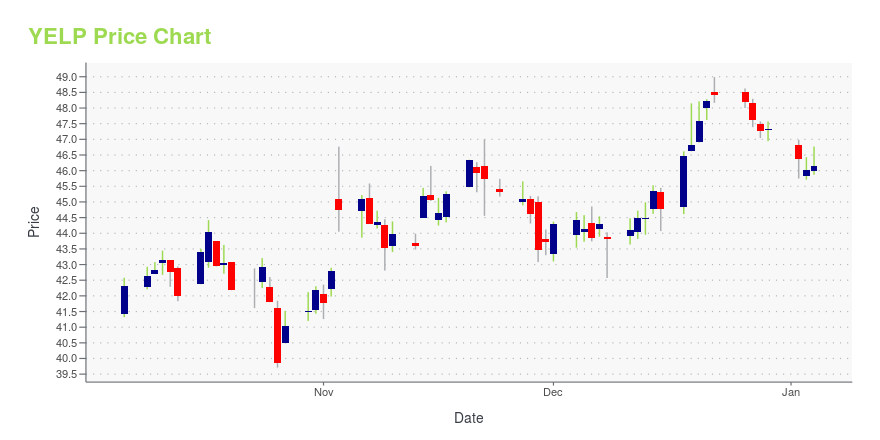
Current price | $36.35 | 52-week high | $39.26 |
Prev. close | $35.71 | 52-week low | $25.30 |
Day low | $35.47 | Volume | 865,400 |
Day high | $36.43 | Avg. volume | 625,955 |
50-day MA | $30.91 | Dividend yield | N/A |
200-day MA | $31.41 | Market Cap | 2.50B |
YELP Stock Price Chart Interactive Chart >
YELP POWR Grades
- YELP scores best on the Quality dimension, with a Quality rank ahead of 99.58% of US stocks.
- The strongest trend for YELP is in Stability, which has been heading up over the past 179 days.
- YELP ranks lowest in Momentum; there it ranks in the 12th percentile.
YELP Stock Summary
- With a price/earnings ratio of 65.21, YELP INC P/E ratio is greater than that of about 91.86% of stocks in our set with positive earnings.
- With a year-over-year growth in debt of -26.7%, YELP INC's debt growth rate surpasses just 12.48% of about US stocks.
- In terms of twelve month growth in earnings before interest and taxes, YELP INC is reporting a growth rate of 80.78%; that's higher than 85.38% of US stocks.
- Stocks with similar financial metrics, market capitalization, and price volatility to YELP INC are CRCT, DLB, VRAY, MMAT, and TBLA.
- YELP's SEC filings can be seen here. And to visit YELP INC's official web site, go to www.yelp.com.
YELP Valuation Summary
- YELP's EV/EBIT ratio is 30; this is 41.84% higher than that of the median Technology stock.
- Over the past 137 months, YELP's price/sales ratio has gone down 15.9.
Below are key valuation metrics over time for YELP.
Stock | Date | P/S | P/B | P/E | EV/EBIT |
---|---|---|---|---|---|
YELP | 2023-05-22 | 1.8 | 3.2 | 62.0 | 30.0 |
YELP | 2023-05-19 | 1.8 | 3.2 | 62.5 | 30.2 |
YELP | 2023-05-18 | 1.9 | 3.3 | 63.9 | 30.9 |
YELP | 2023-05-17 | 1.8 | 3.1 | 61.4 | 29.7 |
YELP | 2023-05-16 | 1.8 | 3.1 | 60.3 | 29.1 |
YELP | 2023-05-15 | 1.7 | 3.0 | 58.3 | 28.0 |
YELP Growth Metrics
- Its year over year cash and equivalents growth rate is now at -20.94%.
- Its 3 year cash and equivalents growth rate is now at 46.76%.
- Its year over year net income to common stockholders growth rate is now at 558.5%.

The table below shows YELP's growth in key financial areas (numbers in millions of US dollars).
Date | Revenue | Operating Cash Flow | Net Income to Common Stock |
---|---|---|---|
2022-09-30 | 1,157.803 | 192.756 | 39.392 |
2022-06-30 | 1,118.067 | 181.78 | 48.349 |
2022-03-31 | 1,076.371 | 213.627 | 44.552 |
2021-12-31 | 1,031.839 | 212.655 | 39.671 |
2021-09-30 | 991.634 | 216.051 | 37.57 |
2021-06-30 | 943.286 | 228.559 | 18.485 |
YELP's Quality Factors
The “Quality” component of the POWR Ratings focuses on 31 different factors of a companies fundamentals and operational strength. Here are some key insights as we drill into the specifics of these quality attributes.- YELP has a Quality Grade of A, ranking ahead of 98.86% of graded US stocks.
- YELP's asset turnover comes in at 0.832 -- ranking 18th of 50 Personal Services stocks.
- UHAL, CRAI, and R are the stocks whose asset turnover ratios are most correlated with YELP.
The table below shows YELP's key quality metrics over time.
Period | Asset Turnover | Gross Margin | ROIC |
---|---|---|---|
2021-06-30 | 0.832 | 0.935 | 0.034 |
2021-03-31 | 0.760 | 0.935 | -0.037 |
2020-12-31 | 0.784 | 0.934 | -0.064 |
2020-09-30 | 0.832 | 0.936 | -0.047 |
2020-06-30 | 0.893 | 0.935 | -0.036 |
2020-03-31 | 0.964 | 0.937 | 0.029 |
Yelp Inc. (YELP) Company Bio
Yelp Inc. operates a website covering various local business categories, including restaurants, shopping, beauty and fitness, arts, entertainment and events, home and local services, health, nightlife, travel and hotel, auto, and others categories. The company was founded in 2004 and is based in San Francisco, California.
Latest YELP News From Around the Web
Below are the latest news stories about YELP INC that investors may wish to consider to help them evaluate YELP as an investment opportunity.
As Activists 'Yelp,' Should Investors Buy?Here's my 'review' of YELP after TCS Capital Management delivered an open letter to the company's board. |
Here is Why Growth Investors Should Buy Yelp (YELP) NowYelp (YELP) is well positioned to outperform the market, as it exhibits above-average growth in financials. |
YELP Stock Alert: Can an Activist Investor Save Yelp?YELP stock is trending on social media and climbing 11%. |
CVX Stock Price Prediction: Is Chevron Really Worth $189?Chevron (CVX) stock is a hot topic among traders on Tuesday after the oil company got a new price prediction and upgrade! |
PACW Stock Alert: The $2.6 Billion Reason PacWest Is Up TodayPacWest (PACW) stock is taking off on Tuesday as investors react to the regional bank selling $2.6 billion in real estate loans. |
YELP Price Returns
1-mo | 30.99% |
3-mo | 27.23% |
6-mo | 30.01% |
1-year | 14.70% |
3-year | 32.57% |
5-year | -13.53% |
YTD | 32.96% |
2022 | -24.56% |
2021 | 10.93% |
2020 | -6.20% |
2019 | -0.46% |
2018 | -16.61% |
Continue Researching YELP
Want to see what other sources are saying about Yelp Inc's financials and stock price? Try the links below:Yelp Inc (YELP) Stock Price | Nasdaq
Yelp Inc (YELP) Stock Quote, History and News - Yahoo Finance
Yelp Inc (YELP) Stock Price and Basic Information | MarketWatch
Loading social stream, please wait...