YETI Holdings, Inc. (YETI): Price and Financial Metrics
YETI Price/Volume Stats
Current price | $47.51 | 52-week high | $51.27 |
Prev. close | $47.40 | 52-week low | $27.86 |
Day low | $46.64 | Volume | 1,043,600 |
Day high | $47.62 | Avg. volume | 1,232,979 |
50-day MA | $45.08 | Dividend yield | N/A |
200-day MA | $41.50 | Market Cap | 4.12B |
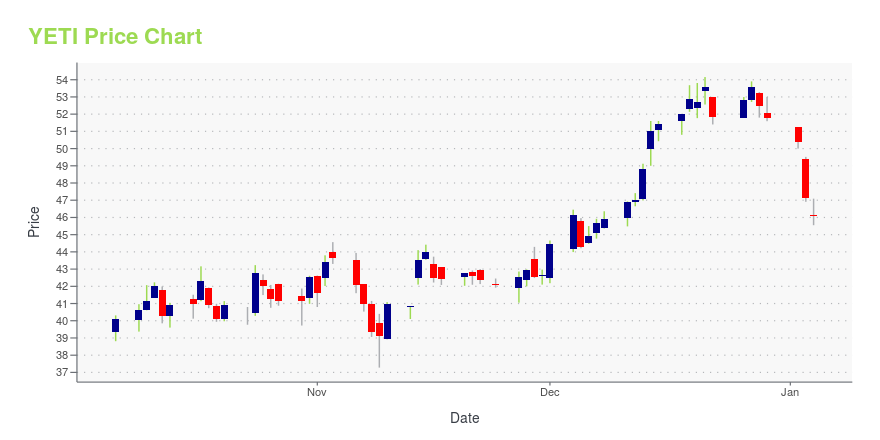
YETI Stock Price Chart Interactive Chart >
YETI POWR Grades
- YETI scores best on the Quality dimension, with a Quality rank ahead of 94.86% of US stocks.
- The strongest trend for YETI is in Sentiment, which has been heading up over the past 177 days.
- YETI ranks lowest in Sentiment; there it ranks in the 5th percentile.
YETI Stock Summary
- YETI HOLDINGS INC's capital turnover -- a measure of revenue relative to shareholder's equity -- is better than 79.91% of US listed stocks.
- YETI's current price/earnings ratio is 61.9, which is higher than 90.81% of US stocks with positive earnings.
- Of note is the ratio of YETI HOLDINGS INC's sales and general administrative expense to its total operating expenses; 97.73% of US stocks have a lower such ratio.
- Stocks with similar financial metrics, market capitalization, and price volatility to YETI HOLDINGS INC are BARK, RHI, BKE, BOOT, and CTG.
- Visit YETI's SEC page to see the company's official filings. To visit the company's web site, go to www.YETI.com.
YETI Valuation Summary
- YETI's price/sales ratio is 2.6; this is 36.84% higher than that of the median Consumer Cyclical stock.
- Over the past 59 months, YETI's price/earnings ratio has gone down 31.2.
Below are key valuation metrics over time for YETI.
Stock | Date | P/S | P/B | P/E | EV/EBIT |
---|---|---|---|---|---|
YETI | 2023-09-13 | 2.6 | 6.9 | 61.1 | 44.1 |
YETI | 2023-09-12 | 2.5 | 6.9 | 60.8 | 43.8 |
YETI | 2023-09-11 | 2.6 | 6.9 | 61.3 | 44.2 |
YETI | 2023-09-08 | 2.6 | 7.0 | 61.8 | 44.5 |
YETI | 2023-09-07 | 2.6 | 7.1 | 62.4 | 45.0 |
YETI | 2023-09-06 | 2.6 | 7.2 | 63.3 | 45.6 |
YETI's Quality Factors
The “Quality” component of the POWR Ratings focuses on 31 different factors of a companies fundamentals and operational strength. Here are some key insights as we drill into the specifics of these quality attributes.- YETI has a Quality Grade of A, ranking ahead of 99.6% of graded US stocks.
- YETI's asset turnover comes in at 1.675 -- ranking 5th of 21 Recreation stocks.
- 500 - Internal server error
The table below shows YETI's key quality metrics over time.
Period | Asset Turnover | Gross Margin | ROIC |
---|---|---|---|
2021-07-03 | 1.675 | 0.590 | 0.805 |
2021-04-03 | 1.658 | 0.585 | 0.641 |
2021-01-02 | 1.592 | 0.576 | 0.469 |
2020-09-26 | 1.538 | 0.559 | 0.262 |
2020-06-27 | 1.527 | 0.540 | 0.189 |
2020-03-28 | 1.557 | 0.527 | 0.174 |
YETI Holdings, Inc. (YETI) Company Bio
YETI Holdings, Inc. engages in the design, marketing, and distribution of products for the outdoor and recreation market. Its products include coolers, drinkware, travel bags, backpacks, multipurpose buckets, outdoor chairs, blankets, dog bowls, apparel, and accessories. The company was founded by Roy J. Seiders and Ryan R. Seiders in 2006 and is headquartered in Austin, TX.
Latest YETI News From Around the Web
Below are the latest news stories about YETI HOLDINGS INC that investors may wish to consider to help them evaluate YETI as an investment opportunity.
YETI Holdings, Inc.'s (NYSE:YETI) Intrinsic Value Is Potentially 67% Above Its Share PriceKey Insights The projected fair value for YETI Holdings is US$79.52 based on 2 Stage Free Cash Flow to Equity Current... |
7 Consumer Stocks to Sell in September Before They Crash & BurnWith discretionary cash becoming scarce and analyst sentiment souring, it’s time to look at consumer stocks to sell. |
YETI Holdings, Inc.'s (NYSE:YETI) Stock's On An Uptrend: Are Strong Financials Guiding The Market?Most readers would already be aware that YETI Holdings' (NYSE:YETI) stock increased significantly by 28% over the past... |
Why I'm Not Buying Yeti Stock YetYeti (NYSE: YETI) continues to report solid margins, but the company's growth is slowing, and the stock is still expensive. In this video, Travis Hoium highlights the company's most recent results and why he's not buying the stock yet. |
YETI Holdings Stock Sees IBD RS Rating Rise To 73YETI Holdings shows rising price performance, earning an upgrade to its IBD Relative Strength Rating |
YETI Price Returns
1-mo | 1.84% |
3-mo | 24.01% |
6-mo | 21.85% |
1-year | 62.15% |
3-year | 5.13% |
5-year | N/A |
YTD | 15.01% |
2022 | -50.13% |
2021 | 20.97% |
2020 | 96.87% |
2019 | 134.37% |
2018 | N/A |
Continue Researching YETI
Want to see what other sources are saying about YETI Holdings Inc's financials and stock price? Try the links below:YETI Holdings Inc (YETI) Stock Price | Nasdaq
YETI Holdings Inc (YETI) Stock Quote, History and News - Yahoo Finance
YETI Holdings Inc (YETI) Stock Price and Basic Information | MarketWatch
Loading social stream, please wait...