Y-mAbs Therapeutics, Inc. (YMAB): Price and Financial Metrics

Y-mAbs Therapeutics, Inc. (YMAB): $16.32

0.18 (-1.09%)

POWR Rating

Component Grades

Momentum

C

Stability

D

Sentiment

Quality

C

Add YMAB to Watchlist
Sign Up

YMAB Price/Volume Stats

Current price $16.32 52-week high $20.90
Prev. close $16.50 52-week low $3.13
Day low $15.94 Volume 47,090
Day high $16.48 Avg. volume 409,489
50-day MA $14.72 Dividend yield N/A
200-day MA $8.25 Market Cap 714.44M

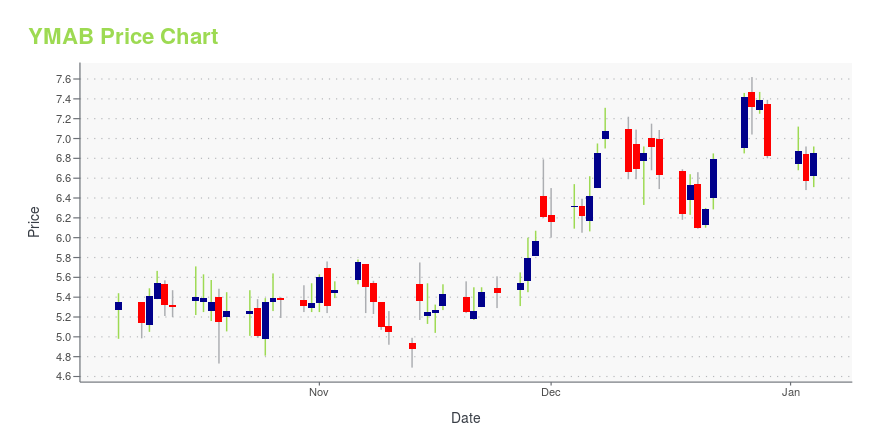
YMAB Stock Price Chart Interactive Chart >

YMAB POWR Grades

  • YMAB scores best on the Value dimension, with a Value rank ahead of 91.03% of US stocks.
  • YMAB's strongest trending metric is Growth; it's been moving down over the last 26 weeks.
  • YMAB's current lowest rank is in the Stability metric (where it is better than 10.11% of US stocks).

YMAB Stock Summary

  • The ratio of debt to operating expenses for Y-MABS THERAPEUTICS INC is higher than it is for about just 5.66% of US stocks.
  • With a year-over-year growth in debt of -26.86%, Y-MABS THERAPEUTICS INC's debt growth rate surpasses merely 12.02% of about US stocks.
  • Revenue growth over the past 12 months for Y-MABS THERAPEUTICS INC comes in at 113.97%, a number that bests 95.98% of the US stocks we're tracking.
  • Stocks that are quantitatively similar to YMAB, based on their financial statements, market capitalization, and price volatility, are VYNE, MVIS, HLTH, LCID, and SAGE.
  • YMAB's SEC filings can be seen here. And to visit Y-MABS THERAPEUTICS INC's official web site, go to www.ymabs.com.

YMAB Valuation Summary

  • YMAB's price/earnings ratio is -15.4; this is 152.83% lower than that of the median Healthcare stock.
  • Over the past 64 months, YMAB's price/sales ratio has gone NA NA.

Below are key valuation metrics over time for YMAB.

Stock Date P/S P/B P/E EV/EBIT
YMAB 2023-12-29 3.2 3.0 -15.4 -9.0
YMAB 2023-12-28 3.5 3.2 -16.7 -10.1
YMAB 2023-12-27 3.4 3.2 -16.6 -9.9
YMAB 2023-12-26 3.5 3.2 -16.8 -10.1
YMAB 2023-12-22 3.2 3.0 -15.4 -8.9
YMAB 2023-12-21 3.0 2.7 -14.2 -8.0

YMAB's Quality Factors

The “Quality” component of the POWR Ratings focuses on 31 different factors of a companies fundamentals and operational strength. Here are some key insights as we drill into the specifics of these quality attributes.
  • YMAB has a Quality Grade of C, ranking ahead of 28.99% of graded US stocks.
  • YMAB's asset turnover comes in at 0.183 -- ranking 204th of 681 Pharmaceutical Products stocks.
  • 500 - Internal server error

The table below shows YMAB's key quality metrics over time.

Period Asset Turnover Gross Margin ROIC
2021-06-30 0.183 0.992 -10.948
2021-03-31 0.146 0.996 -77.742
2020-12-31 0.130 1.000 45.423
2020-09-30 0.000 NA 33.823
2020-06-30 0.000 NA 26.410
2020-03-31 0.000 NA 20.272

YMAB Price Target

For more insight on analysts targets of YMAB, see our YMAB price target page. And for a list of of all stocks sorted by upside potential based on analyst target price, see our Top Price Target page.

Average Price Target $55.00 Average Broker Recommendation 1.36 (Strong Buy)

Y-mAbs Therapeutics, Inc. (YMAB) Company Bio


Y-mAbs Therapeutics, Inc., a clinical-stage biopharmaceutical company, focuses on the development and commercialization of novel antibody therapeutic products for cancer treatment in the United States. It is developing naxitamab for the treatment of pediatric patients with relapsed or refractory, high-risk neuroblastoma, as well as other GD2 positive tumors; and omburtamab for the treatment of pediatric patients with central nervous system/leptomeningeal metastases, desmoplastic small round cell tumors, diffuse intrinsic pontine glioma, and other B7-H3 positive tumors. The company has a license and research collaboration agreement with Memorial Sloan-Kettering Cancer Center. Y-mAbs Therapeutics, Inc. was founded in 2015 and is based in New York, New York.


YMAB Latest News Stream


Event/Time News Detail
Loading, please wait...

YMAB Latest Social Stream


Loading social stream, please wait...

View Full YMAB Social Stream

Latest YMAB News From Around the Web

Below are the latest news stories about Y-MABS THERAPEUTICS INC that investors may wish to consider to help them evaluate YMAB as an investment opportunity.

Y-mAbs Therapeutics Added to the NASDAQ Biotechnology Index

NEW YORK, Dec. 13, 2023 (GLOBE NEWSWIRE) -- Y-mAbs Therapeutics, Inc. (the “Company” or “Y-mAbs”) (Nasdaq: YMAB), a commercial-stage biopharmaceutical company focused on the development and commercialization of novel, antibody-based therapeutic products for the treatment of cancer, today announced it will be added to the NASDAQ Biotechnology Index (NASDAQ: NBI), effective prior to the market open on Monday, December 18, 2023. The NASDAQ Biotechnology Index is designed to track the performance of

Yahoo | December 13, 2023

Director Biotech Wg's Strategic Investment in Y-mAbs Therapeutics Inc

Y-mAbs Therapeutics Inc (NASDAQ:YMAB), a commercial-stage biopharmaceutical company, has recently witnessed a significant insider purchase that has caught the attention of investors and market analysts alike.

Yahoo | December 12, 2023

Director Biotech Wg's Strategic Investment in Y-mAbs Therapeutics Inc (YMAB)

Y-mAbs Therapeutics Inc (NASDAQ:YMAB), a commercial-stage biopharmaceutical company, has recently witnessed a significant insider purchase that has caught the attention of investors and market analysts alike.

Yahoo | December 1, 2023

Y-mAbs Therapeutics, Inc. (NASDAQ:YMAB) Q3 2023 Earnings Call Transcript

Y-mAbs Therapeutics, Inc. (NASDAQ:YMAB) Q3 2023 Earnings Call Transcript November 14, 2023 Operator: Good morning and welcome to Y-mAbs Therapeutics Third Quarter 2023 Earnings Conference Call. Please note that today’s event is being recorded. At this time, all participants are in a listen-only mode. Instructions for the question-and-answer session will follow after the prepared remarks. […]

Yahoo | November 15, 2023

Q3 2023 Y-mAbs Therapeutics Inc Earnings Call

Q3 2023 Y-mAbs Therapeutics Inc Earnings Call

Yahoo | November 15, 2023

Read More 'YMAB' Stories Here

YMAB Price Returns

1-mo -1.09%
3-mo 139.30%
6-mo 199.45%
1-year 403.70%
3-year -44.03%
5-year -37.73%
YTD 139.30%
2023 39.75%
2022 -69.90%
2021 -67.26%
2020 58.43%
2019 53.64%

Get Free Updates

Join thousands of investors who get the latest news, insights and top rated picks from StockNews.com!