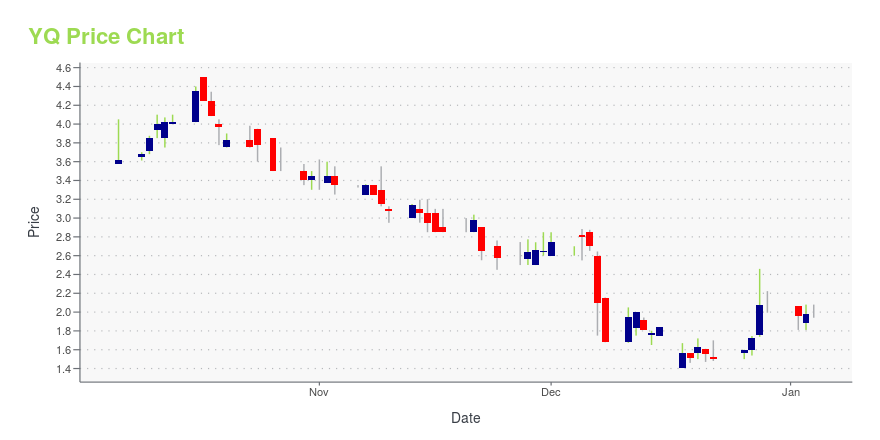
M17 Entertainment Limited ADR (YQ): Price and Financial Metrics
YQ Price/Volume Stats
| Current price | $2.13 | 52-week high | $5.00 |
| Prev. close | $2.24 | 52-week low | $1.41 |
| Day low | $2.13 | Volume | 7,800 |
| Day high | $2.32 | Avg. volume | 11,152 |
| 50-day MA | $2.34 | Dividend yield | N/A |
| 200-day MA | $2.63 | Market Cap | 82.51M |
YQ Stock Price Chart Interactive Chart >
M17 Entertainment Limited ADR (YQ) Company Bio
M17 Entertainment Limited operates live streaming platform in Taiwan, Japan, South Korea, Singapore, and Hong Kong. The company also provides online dating services. It live streaming services under 17 Media brand name; and online dating services under Paktor and Goodnight brands. The company was founded in 2015 and is based in Taipei City, Taiwan.
Latest YQ News From Around the Web
Below are the latest news stories about 17 EDUCATION & TECHNOLOGY GROUP INC that investors may wish to consider to help them evaluate YQ as an investment opportunity.
17 Education & Technology Group Inc. Announces Plan to Implement ADS Ratio ChangeBEIJING, Dec. 13, 2023 (GLOBE NEWSWIRE) -- 17 Education & Technology Group Inc. (Nasdaq: YQ) (“17EdTech” or the “Company”), a leading education technology company in China, today announced that it plans to change the ratio of its American Depositary Shares (“ADSs”) to its Class A ordinary shares (the “ADS Ratio”), par value US$0.0001 per share, from the current ADS Ratio of one (1) ADS to ten (10) Class A ordinary shares to a new ADS Ratio of one (1) ADS to fifty (50) Class A ordinary shares, ef |
17 Education & Technology Group Inc. Announces Third Quarter 2023 Unaudited Financial ResultsBEIJING, Dec. 07, 2023 (GLOBE NEWSWIRE) -- 17 Education & Technology Group Inc. (NASDAQ: YQ) (“17EdTech” or the “Company”), a leading education technology company in China, today announced its unaudited financial results for the third quarter of 2023. Third Quarter 2023 Highlights1 Net revenues were RMB45.1 million (US$6.2 million), compared with net revenues of RMB124.6 million in the third quarter of 2022.Gross margin was 54.1%, compared with 74.5% in the third quarter of 2022.Net loss was RMB |
17 Education & Technology Group Inc. to Report Third Quarter 2023 Unaudited Financial Results on December 6, 2023BEIJING, China, Nov. 30, 2023 (GLOBE NEWSWIRE) -- 17 Education & Technology Group Inc. (NASDAQ: YQ) (“17EdTech” or the “Company”), a leading education technology company in China, today announced that it will report its unaudited financial results for the third quarter ended September 30, 2023, on December 6, 2023 after the close of U.S. markets. The Company’s management will hold an earnings conference call on Wednesday, December 6, 2023 at 8:00 p.m. U.S. Eastern Time (Thursday, December 7, 202 |
Q2 2023 17 Education & Technology Group Inc Earnings CallQ2 2023 17 Education & Technology Group Inc Earnings Call |
17 Education & Technology Group Inc. Announces Second Quarter 2023 Unaudited Financial ResultsBEIJING, China, Aug. 29, 2023 (GLOBE NEWSWIRE) -- 17 Education & Technology Group Inc. (NASDAQ: YQ) (“17EdTech” or the “Company”), a leading education technology company in China, today announced its unaudited financial results for the second quarter of 2023. Second Quarter 2023 Highlights1 Net revenues were RMB69.2 million (US$9.5 million), compared with net revenues of RMB133.5 million in the second quarter of 2022.Gross margin was 48.3%, compared with 52.2% in the second quarter of 2022.Net l |
YQ Price Returns
| 1-mo | 9.79% |
| 3-mo | -26.30% |
| 6-mo | -16.63% |
| 1-year | -52.67% |
| 3-year | -90.82% |
| 5-year | N/A |
| YTD | 2.90% |
| 2023 | -79.71% |
| 2022 | 63.20% |
| 2021 | -97.56% |
| 2020 | N/A |
| 2019 | N/A |


Loading social stream, please wait...