ZoomInfo Technologies Inc. (ZI): Price and Financial Metrics
ZI Price/Volume Stats
| Current price | $11.59 | 52-week high | $26.23 |
| Prev. close | $11.31 | 52-week low | $10.83 |
| Day low | $11.29 | Volume | 3,259,411 |
| Day high | $11.60 | Avg. volume | 6,242,628 |
| 50-day MA | $12.26 | Dividend yield | N/A |
| 200-day MA | $14.93 | Market Cap | 4.33B |
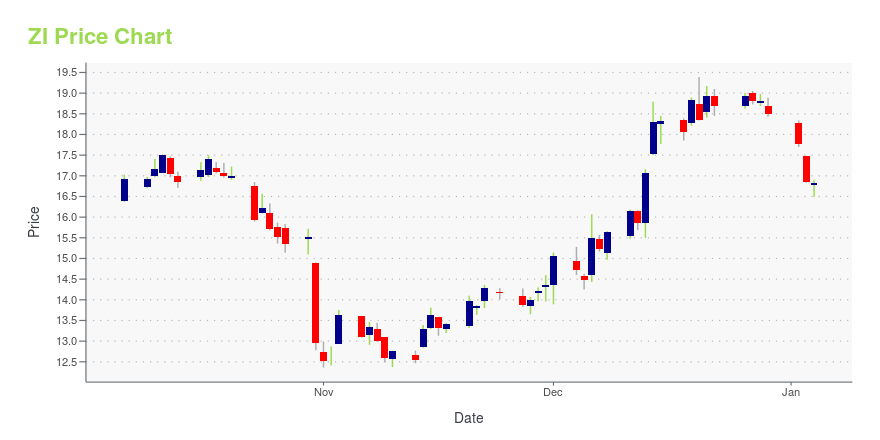
ZI Stock Price Chart Interactive Chart >
ZoomInfo Technologies Inc. (ZI) Company Bio
ZoomInfo Technologies Inc. is a software and data company which provides information and data for companies and business individuals. (Source:Wikipedia)
Latest ZI News From Around the Web
Below are the latest news stories about ZOOMINFO TECHNOLOGIES INC that investors may wish to consider to help them evaluate ZI as an investment opportunity.
ZoomInfo Awarded 150 No. 1 Rankings Among its 306 Leader Ratings in G2’s Winter 2024 ReportsVANCOUVER, Wash., December 21, 2023--ZoomInfo secured the top spot on 30 grids among its 150 No. 1 rankings and 306 Leader ratings in G2’s Winter 2024 Grid Reports. |
12 Best Tech Stocks To Buy On the DipIn this article, we discuss the 12 best tech stocks to buy on the dip. If you want to skip our detailed analysis of these stocks, go directly to 5 Best Tech Stocks To Buy On the Dip. Technology stocks were the winners of the pandemic, climbing to record highs during lockdowns as businesses scrambled […] |
ZoomInfo Technologies Inc. (NASDAQ:ZI) Stocks Shoot Up 37% But Its P/E Still Looks ReasonableZoomInfo Technologies Inc. ( NASDAQ:ZI ) shareholders would be excited to see that the share price has had a great... |
Silicon Surge: 7 Tech Stocks Poised for a Bullish ComebackUndeniably, unless some catastrophic black swan event materializes, 2023 will go down as the year of tech stocks to buy. |
Slowing Rates Of Return At ZoomInfo Technologies (NASDAQ:ZI) Leave Little Room For ExcitementIf you're not sure where to start when looking for the next multi-bagger, there are a few key trends you should keep an... |
ZI Price Returns
| 1-mo | -7.87% |
| 3-mo | -29.20% |
| 6-mo | -27.02% |
| 1-year | -53.79% |
| 3-year | -78.40% |
| 5-year | N/A |
| YTD | -37.32% |
| 2023 | -38.59% |
| 2022 | -53.10% |
| 2021 | 33.11% |
| 2020 | N/A |
| 2019 | N/A |


Loading social stream, please wait...