
Zion Oil & Gas, Inc. (ZNOG): Price and Financial Metrics
ZNOG Price/Volume Stats
| Current price | $0.13 | 52-week high | $0.27 |
| Prev. close | $0.12 | 52-week low | $0.03 |
| Day low | $0.12 | Volume | 465,775 |
| Day high | $0.13 | Avg. volume | 4,335,709 |
| 50-day MA | $0.19 | Dividend yield | N/A |
| 200-day MA | $0.10 | Market Cap | 130.77M |
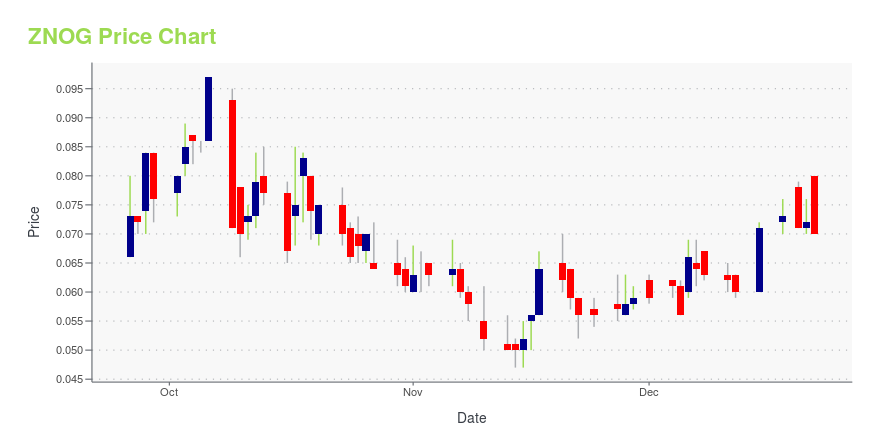
ZNOG Stock Price Chart Interactive Chart >
Zion Oil & Gas, Inc. (ZNOG) Company Bio
Zion Oil & Gas, Inc. explores for oil and natural gas in Israel.
ZNOG Price Returns
| 1-mo | -43.84% |
| 3-mo | 39.63% |
| 6-mo | 221.78% |
| 1-year | 73.80% |
| 3-year | -24.37% |
| 5-year | -47.98% |
| YTD | 16.07% |
| 2024 | 49.53% |
| 2023 | 31.40% |
| 2022 | -65.66% |
| 2021 | -81.56% |
| 2020 | 421.44% |
Loading social stream, please wait...