
Zion Oil & Gas, Inc. (ZNOG): Price and Financial Metrics
ZNOG Price/Volume Stats
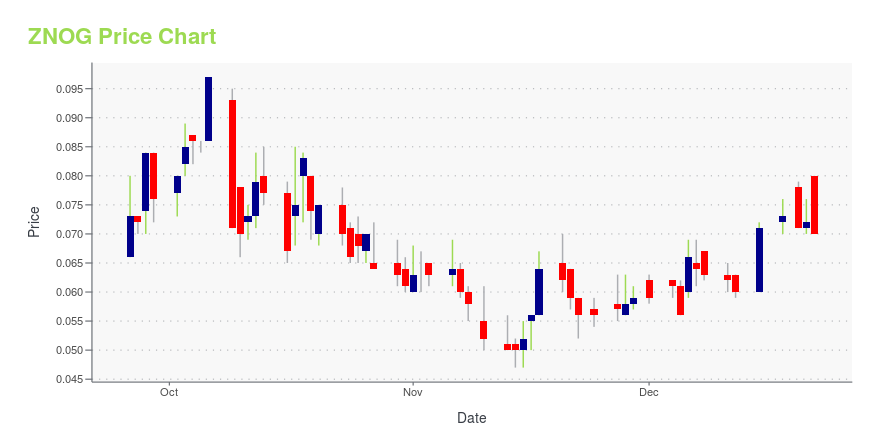
| Current price | $0.06 | 52-week high | $0.10 |
| Prev. close | $0.05 | 52-week low | $0.05 |
| Day low | $0.05 | Volume | 2,990,125 |
| Day high | $0.06 | Avg. volume | 2,572,369 |
| 50-day MA | $0.06 | Dividend yield | N/A |
| 200-day MA | $0.06 | Market Cap | 42.86M |
ZNOG Stock Price Chart Interactive Chart >
Zion Oil & Gas, Inc. (ZNOG) Company Bio
Zion Oil & Gas, Inc. explores for oil and natural gas in Israel.
Latest ZNOG News From Around the Web
Below are the latest news stories about ZION OIL & GAS INC that investors may wish to consider to help them evaluate ZNOG as an investment opportunity.
Zion Oil & Gas, Inc. Announces Award of New Megiddo Valleys License 434 Allowing for Ongoing Oil And Gas Exploration in IsraelZion Oil & Gas, Inc. (OTCQX: ZNOG) is excited to announce that the State of Israel has awarded Zion a new exploration license, named the Megiddo Valleys #434. |
Zion Oil & Gas, Inc. Announces Significant Progress and Launch of a New Unit ProgramZion Oil & Gas, Inc. (OTCQX: ZNOG) celebrates significant milestones and divine guidance leading the company into a new phase of operations in Israel. |
ZNOG Price Returns
| 1-mo | 14.29% |
| 3-mo | -19.35% |
| 6-mo | 0.50% |
| 1-year | -14.16% |
| 3-year | -82.11% |
| 5-year | -81.93% |
| YTD | -19.89% |
| 2023 | 31.40% |
| 2022 | -65.66% |
| 2021 | -81.56% |
| 2020 | 421.44% |
| 2019 | -58.90% |
Loading social stream, please wait...