
Zomedica Corp. (ZOM): Price and Financial Metrics
ZOM Price/Volume Stats
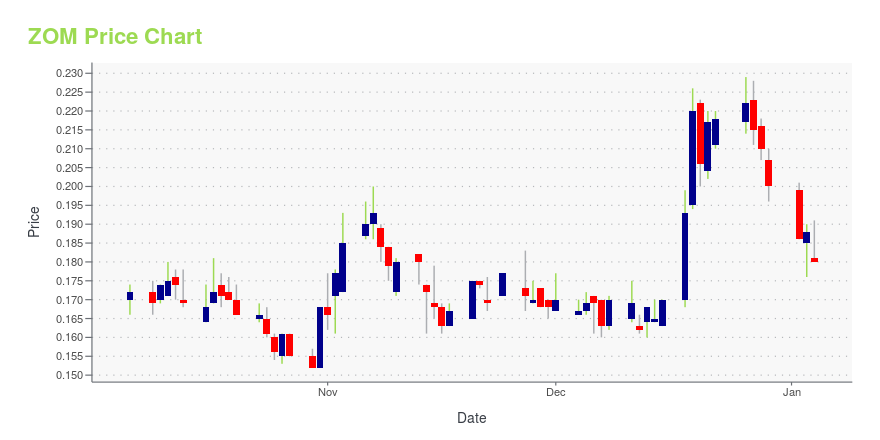
| Current price | $0.15 | 52-week high | $0.23 |
| Prev. close | $0.15 | 52-week low | $0.12 |
| Day low | $0.15 | Volume | 1,851,519 |
| Day high | $0.15 | Avg. volume | 5,111,144 |
| 50-day MA | $0.16 | Dividend yield | N/A |
| 200-day MA | $0.15 | Market Cap | 147.48M |
ZOM Stock Price Chart Interactive Chart >
Zomedica Corp. (ZOM) Company Bio
Zomedica Pharmaceuticals Corp. operates as a veterinary pharmaceutical company in the United States. It focuses on the discovery, development, and commercialization of drugs, novel drug delivery systems, devices, and diagnostics for the health and wellness of companion animals, such as canine, feline, and equine. The company has a research collaboration agreement with Celsee Diagnostics, Inc. to test the feasibility of Celsee's liquid biopsy technology for veterinary application as a canine cancer diagnostics. Zomedica Pharmaceuticals Corp. was founded in 2015 and is based in Ann Arbor, Michigan.
Latest ZOM News From Around the Web
Below are the latest news stories about ZOMEDICA CORP that investors may wish to consider to help them evaluate ZOM as an investment opportunity.
Zomedica Announces Expansion of Market Opportunity for TRUFORMA(R) Diagnostic Platform with Launch of Three New Assays for Commonly Performed Diagnostic Tests for Canine Gastrointestinal DiseaseANN ARBOR, MI / ACCESSWIRE / December 18, 2023 / Zomedica Corp. (NYSE American:ZOM) ("Zomedica" or the "Company"), a veterinary health company offering point-of-care diagnostics and therapeutic products for equine and companion animals, today announced ... |
Zomedica Announces Presentation of Clinical Data in Support of New Indications for PulseVet Shock Wave Therapy at Annual Meeting of American Association of Equine PractitionersANN ARBOR, MI / ACCESSWIRE / December 6, 2023 / Zomedica Corp. (NYSE American:ZOM) ("Zomedica" or the "Company"), a veterinary health company offering point-of-care diagnostics and therapeutic products for equine and companion animals, today announced ... |
Zomedica to Present at Noble Capital Markets' 19th Annual Emerging Growth Equity ConferenceANN ARBOR, MI / ACCESSWIRE / November 28, 2023 / Zomedica Corp. (NYSE American:ZOM) ("Zomedica" or the "Company"), a veterinary health company offering point-of-care diagnostics and therapeutic products for companion animals, today announced that ... |
Zomedica to Present at the 35th Annual Piper Sandler Healthcare ConferenceANN ARBOR, MI / ACCESSWIRE / November 20, 2023 / Zomedica Corp. (NYSE American:ZOM) ("Zomedica" or the "Company"), a veterinary health company offering point-of-care diagnostics and therapeutic products for companion animals, today announced that ... |
Zomedica Announces Record Third Quarter 2023 Financial Results: Revenue up 31% to $6.3 Million; 69% Gross Margin, and $118 Million in Liquidity, while Making Strategic Acquisitions of Structured Monitoring Products and Qorvo BiotechnologiesANN ARBOR, MI / ACCESSWIRE / November 13, 2023 / Zomedica Corp. (NYSE American:ZOM) ("Zomedica" or the "Company"), a veterinary health company offering point-of-care diagnostics and therapeutic products for companion animals, today reported consolidated ... |
ZOM Price Returns
| 1-mo | 3.81% |
| 3-mo | 12.78% |
| 6-mo | 13.04% |
| 1-year | -27.54% |
| 3-year | -75.03% |
| 5-year | -40.02% |
| YTD | -25.07% |
| 2023 | 22.82% |
| 2022 | -46.82% |
| 2021 | 32.91% |
| 2020 | -30.33% |
| 2019 | -73.09% |
Loading social stream, please wait...