Zoetis Inc. (ZTS): Price and Financial Metrics
GET POWR RATINGS... FREE!
ZTS POWR Grades
- ZTS scores best on the Quality dimension, with a Quality rank ahead of 96.35% of US stocks.
- ZTS's strongest trending metric is Momentum; it's been moving down over the last 179 days.
- ZTS's current lowest rank is in the Momentum metric (where it is better than 14.48% of US stocks).
ZTS Stock Summary
- ZTS has a market capitalization of $90,750,503,122 -- more than approximately 97.07% of US stocks.
- With a one year PEG ratio of 204.33, Zoetis Inc is expected to have a higher PEG ratio (a measure of how expensive a stock is relative to its expected earnings growth) than 87.91% of US stocks.
- ZTS's price/sales ratio is 11.67; that's higher than the P/S ratio of 87.5% of US stocks.
- If you're looking for stocks that are quantitatively similar to Zoetis Inc, a group of peers worth examining would be MMM, SYK, GE, BSX, and ABB.
- Visit ZTS's SEC page to see the company's official filings. To visit the company's web site, go to www.zoetis.com.
ZTS Valuation Summary
- In comparison to the median Healthcare stock, ZTS's EV/EBIT ratio is 33.45% higher, now standing at 39.1.
- ZTS's price/sales ratio has moved up 9.4 over the prior 104 months.
- Over the past 104 months, ZTS's price/earnings ratio has gone down 12.5.
Below are key valuation metrics over time for ZTS.
Stock | Date | P/S | P/B | P/E | EV/EBIT |
---|---|---|---|---|---|
ZTS | 2021-08-31 | 13.1 | 22.3 | 50.8 | 39.1 |
ZTS | 2021-08-30 | 13.2 | 22.4 | 51.1 | 39.3 |
ZTS | 2021-08-27 | 13.0 | 22.2 | 50.6 | 38.9 |
ZTS | 2021-08-26 | 13.0 | 22.2 | 50.7 | 39.0 |
ZTS | 2021-08-25 | 13.1 | 22.3 | 50.8 | 39.0 |
ZTS | 2021-08-24 | 13.1 | 22.3 | 50.9 | 39.1 |
ZTS Growth Metrics
- The 5 year net cashflow from operations growth rate now stands at 176.95%.
- The year over year net cashflow from operations growth rate now stands at 16.76%.
- Its 5 year revenue growth rate is now at 31.38%.

The table below shows ZTS's growth in key financial areas (numbers in millions of US dollars).
Date | Revenue | Operating Cash Flow | Net Income to Common Stock |
---|---|---|---|
2021-12-31 | 7,776 | 2,213 | 2,037 |
2021-09-30 | 7,616 | 2,252 | 1,982 |
2021-06-30 | 7,412 | 2,161 | 1,909 |
2021-03-31 | 7,012 | 2,118 | 1,774 |
2020-12-31 | 6,675 | 2,126 | 1,638 |
2020-09-30 | 6,542 | 1,990 | 1,663 |
ZTS's Quality Factors
The “Quality” component of the POWR Ratings focuses on 31 different factors of a companies fundamentals and operational strength. Here are some key insights as we drill into the specifics of these quality attributes.- ZTS has a Quality Grade of A, ranking ahead of 95.14% of graded US stocks.
- ZTS's asset turnover comes in at 0.552 -- ranking 69th of 682 Pharmaceutical Products stocks.
- UTHR, ENDP, and MYGN are the stocks whose asset turnover ratios are most correlated with ZTS.
The table below shows ZTS's key quality metrics over time.
Period | Asset Turnover | Gross Margin | ROIC |
---|---|---|---|
2021-09-30 | 0.552 | 0.697 | 0.236 |
2021-06-30 | 0.537 | 0.695 | 0.233 |
2021-03-31 | 0.518 | 0.694 | 0.219 |
2020-12-31 | 0.514 | 0.692 | 0.206 |
2020-09-30 | 0.525 | 0.696 | 0.212 |
2020-06-30 | 0.535 | 0.697 | 0.207 |
ZTS Price Target
For more insight on analysts targets of ZTS, see our ZTS price target page. And for a list of of all stocks sorted by upside potential based on analyst target price, see our Top Price Target page.
Average Price Target | $185.00 | Average Broker Recommendation | 1.34 (Strong Buy) |
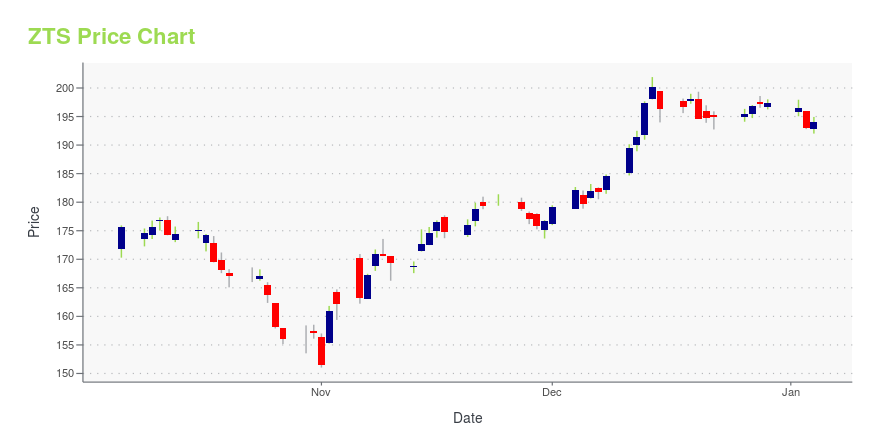
ZTS Stock Price Chart Interactive Chart >
ZTS Price/Volume Stats
Current price | $174.21 | 52-week high | $249.27 |
Prev. close | $171.89 | 52-week low | $154.18 |
Day low | $170.50 | Volume | 1,498,400 |
Day high | $174.50 | Avg. volume | 2,378,639 |
50-day MA | $168.51 | Dividend yield | 0.75% |
200-day MA | $196.82 | Market Cap | 81.99B |
Zoetis Inc. (ZTS) Company Bio
Zoetis Inc. is an American drug company, the world's largest producer of medicine and vaccinations for pets and livestock. The company was a subsidiary of Pfizer, the world's largest drug maker, but with Pfizer's spinoff of its 83% interest in the firm it is now a completely independent company. The company directly markets the products in approximately 45 countries, and sells the products in more than 100 countries. Operations outside the United States accounted for 50% of the total revenue. Contemporaneous with the spinoff in June 2013 S&P Dow Jones Indices announced that Zoetis would replace First Horizon National Corporation in the S&P 500 stock market index. (Source:Wikipedia)
Latest ZTS News From Around the Web
Below are the latest news stories about Zoetis Inc that investors may wish to consider to help them evaluate ZTS as an investment opportunity.
3 Beaten-Down Growth Stocks With More Than 50% Upside PotentialThe key to picking growth stocks right now is to look for companies whose earnings momentum and growth can withstand any market conditions. |
Zoetis to Participate in the Bank of America Securities 2022 Animal Health SummitPARSIPPANY, N.J., February 22, 2022--Zoetis Inc. (NYSE:ZTS) will participate in the Bank of America Securities 2022 Animal Health Summit on Thursday, Feb. 24, 2022. |
Analysts Are Bullish on These Healthcare Stocks: Zoetis (ZTS), SAGE Therapeutics (SAGE)There's a lot to be optimistic about in the Healthcare sector as 3 analysts just weighed in on Zoetis (ZTS – Research Report), SAGE Therapeutics (SAGE – Research Report) and Crispr Therapeutics AG (CRSP – Research Report) with bullish sentiments. Zoetis (ZTS) In a report released yesterday, David Steinberg from Jefferies maintained a Buy rating on Zoetis, with a price target of $235.00. The company's shares closed last Tuesday at $197.76. According to TipRanks. |
Company News for Feb 16, 2022Companies In The News Are: MAR, ZTS, TRP, ANET. |
4 Top Stock Trades for Wednesday: NVDA, SPCE, ABNB, ZTSNvidia, Virgin Galactic, Airbnb and Zoetis were our top stock trades for Wednesday. |
ZTS Price Returns
1-mo | 3.08% |
3-mo | -7.54% |
6-mo | -22.35% |
1-year | -9.07% |
3-year | 53.67% |
5-year | 185.99% |
YTD | -28.37% |
2021 | 48.26% |
2020 | 25.76% |
2019 | 55.71% |
2018 | 19.45% |
2017 | 35.55% |
ZTS Dividends
Ex-Dividend Date | Type | Payout Amount | Change | ||||||
---|---|---|---|---|---|---|---|---|---|
Loading, please wait... |
Continue Researching ZTS
Here are a few links from around the web to help you further your research on Zoetis Inc's stock as an investment opportunity:Zoetis Inc (ZTS) Stock Price | Nasdaq
Zoetis Inc (ZTS) Stock Quote, History and News - Yahoo Finance
Zoetis Inc (ZTS) Stock Price and Basic Information | MarketWatch
Loading social stream, please wait...