Applied Materials Inc. (AMAT): Price and Financial Metrics

Applied Materials Inc. (AMAT): $206.23

1.77 (-0.85%)

POWR Rating

Component Grades

Momentum

A

Stability

C

Sentiment

Quality

B

AMAT Price/Volume Stats

Current price $206.23 52-week high $214.91
Prev. close $208.00 52-week low $109.00
Day low $202.71 Volume 5,750,000
Day high $207.65 Avg. volume 6,571,798
50-day MA $190.49 Dividend yield 0.61%
200-day MA $156.56 Market Cap 171.36B

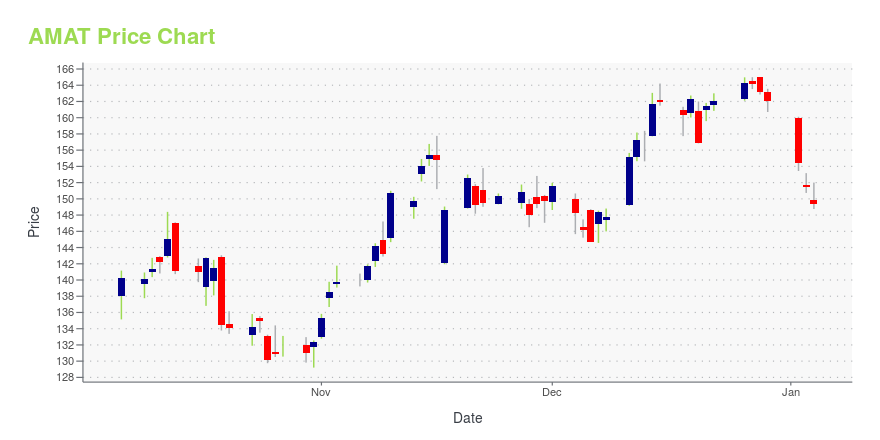
AMAT Stock Price Chart Interactive Chart >

AMAT POWR Grades

  • Momentum is the dimension where AMAT ranks best; there it ranks ahead of 98.31% of US stocks.
  • The strongest trend for AMAT is in Growth, which has been heading down over the past 26 weeks.
  • AMAT's current lowest rank is in the Growth metric (where it is better than 14.73% of US stocks).

AMAT Stock Summary

  • With a market capitalization of $125,865,113,052, APPLIED MATERIALS INC has a greater market value than 98.24% of US stocks.
  • With a one year PEG ratio of 1,131.43, APPLIED MATERIALS INC is expected to have a higher PEG ratio (a measure of how expensive a stock is relative to its expected earnings growth) than 97.04% of US stocks.
  • AMAT's went public 38.03 years ago, making it older than 92.92% of listed US stocks we're tracking.
  • Stocks with similar financial metrics, market capitalization, and price volatility to APPLIED MATERIALS INC are VRTX, LRCX, REGN, QCOM, and MU.
  • Visit AMAT's SEC page to see the company's official filings. To visit the company's web site, go to www.appliedmaterials.com.

AMAT Valuation Summary

  • In comparison to the median Technology stock, AMAT's price/sales ratio is 95.83% higher, now standing at 4.7.
  • Over the past 243 months, AMAT's EV/EBIT ratio has gone up 2023.7.

Below are key valuation metrics over time for AMAT.

Stock Date P/S P/B P/E EV/EBIT
AMAT 2023-12-08 4.7 8.2 19.2 15.9
AMAT 2023-12-07 4.7 8.2 19.3 16.0
AMAT 2023-12-06 4.6 8.0 18.8 15.6
AMAT 2023-12-05 4.6 8.1 19.0 15.8
AMAT 2023-12-04 4.7 8.2 19.3 16.0
AMAT 2023-12-01 4.8 8.4 19.7 16.4

AMAT Growth Metrics

    Its year over year price growth rate is now at -16.51%.
  • The 4 year price growth rate now stands at 22.21%.
  • Its 2 year net income to common stockholders growth rate is now at 131.69%.
AMAT's revenue has moved up $13,311,000,000 over the prior 70 months.

The table below shows AMAT's growth in key financial areas (numbers in millions of US dollars).

Date Revenue Operating Cash Flow Net Income to Common Stock
2022-12-31 26,253 5,011 6,450
2022-09-30 25,785 5,399 6,525
2022-06-30 25,159 5,690 6,646
2022-03-31 24,835 5,907 6,756
2021-12-31 24,172 6,679 6,550
2021-09-30 23,063 5,442 5,888

AMAT's Quality Factors

The “Quality” component of the POWR Ratings focuses on 31 different factors of a companies fundamentals and operational strength. Here are some key insights as we drill into the specifics of these quality attributes.
  • AMAT has a Quality Grade of B, ranking ahead of 85.5% of graded US stocks.
  • AMAT's asset turnover comes in at 0.918 -- ranking 55th of 208 Electronic Equipment stocks.
  • BDR, MPWR, and ADI are the stocks whose asset turnover ratios are most correlated with AMAT.

The table below shows AMAT's key quality metrics over time.

Period Asset Turnover Gross Margin ROIC
2021-08-01 0.918 0.467 0.425
2021-05-02 0.872 0.458 0.367
2021-01-31 0.821 0.450 0.319
2020-10-25 0.808 0.447 0.308
2020-07-26 0.796 0.442 0.285
2020-04-26 0.777 0.440 0.270

AMAT Price Target

For more insight on analysts targets of AMAT, see our AMAT price target page. And for a list of of all stocks sorted by upside potential based on analyst target price, see our Top Price Target page.

Average Price Target $162.38 Average Broker Recommendation 1.53 (Moderate Buy)

Applied Materials Inc. (AMAT) Company Bio


Applied Materials, Inc. is an American corporation that supplies equipment, services and software for the manufacture of semiconductor (integrated circuit) chips for electronics, flat panel displays for computers, smartphones and televisions, and solar products. The company also supplies equipment to produce coatings for flexible electronics, packaging and other applications. The company is headquartered in Santa Clara, California, in Silicon Valley. (Source:Wikipedia)


AMAT Latest News Stream


Event/Time News Detail
Loading, please wait...

AMAT Latest Social Stream


Loading social stream, please wait...

View Full AMAT Social Stream

Latest AMAT News From Around the Web

Below are the latest news stories about APPLIED MATERIALS INC that investors may wish to consider to help them evaluate AMAT as an investment opportunity.

Top 7 Semiconductor Stock Picks for the New Year 

Semiconductors are in the early stages of a super cycle and these seven semiconductor stock picks are expected to stand out in 2024

Chris Markoch on InvestorPlace | December 29, 2023

2024’s Market Leaders: 3 Stocks Set to Outperform in the Next Year

Are you looking for 2024's market leaders to outperform?

Yiannis Zourmpanos on InvestorPlace | December 23, 2023

7 Undervalued Nasdaq-100 Stocks for Bargain Hunters

Understandably, with the innovation sector printing a remarkable performance, all eyes have centered on Nasdaq-100 stocks.

Josh Enomoto on InvestorPlace | December 22, 2023

Why Applied Materials (AMAT) Outpaced the Stock Market Today

In the latest trading session, Applied Materials (AMAT) closed at $162.05, marking a +0.41% move from the previous day.

Yahoo | December 22, 2023

Decoding Applied Materials Inc (AMAT): A Strategic SWOT Insight

Insights from the Latest 10-K Filing: Strengths, Weaknesses, Opportunities, and Threats

Yahoo | December 16, 2023

Read More 'AMAT' Stories Here

AMAT Price Returns

1-mo 4.40%
3-mo 27.46%
6-mo 49.53%
1-year 70.34%
3-year 66.87%
5-year 448.68%
YTD 27.46%
2023 67.97%
2022 -37.54%
2021 83.64%
2020 43.29%
2019 89.86%

AMAT Dividends

Ex-Dividend Date Type Payout Amount Change
Loading, please wait...
View Full AMAT Dividend History

Get Free Updates

Join thousands of investors who get the latest news, insights and top rated picks from StockNews.com!