Amgen Inc. (AMGN): Price and Financial Metrics
AMGN Price/Volume Stats
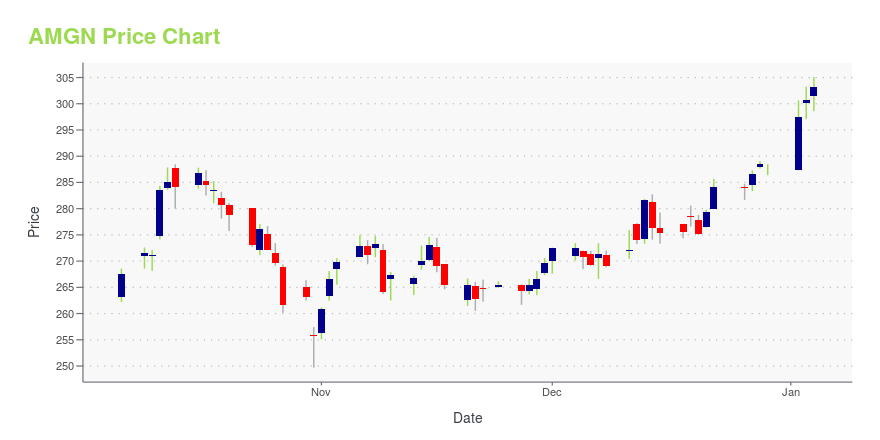
Current price | $284.32 | 52-week high | $329.72 |
Prev. close | $286.30 | 52-week low | $211.71 |
Day low | $284.21 | Volume | 2,284,909 |
Day high | $288.57 | Avg. volume | 3,040,815 |
50-day MA | $290.10 | Dividend yield | 3.2% |
200-day MA | $268.32 | Market Cap | 152.37B |
AMGN Stock Price Chart Interactive Chart >
AMGN POWR Grades
- Quality is the dimension where AMGN ranks best; there it ranks ahead of 96.31% of US stocks.
- The strongest trend for AMGN is in Quality, which has been heading down over the past 26 weeks.
- AMGN ranks lowest in Momentum; there it ranks in the 6th percentile.
AMGN Stock Summary
- AMGN has a higher market value than 98.71% of US stocks; more precisely, its current market capitalization is $160,922,680,939.
- AMGN's went public 38.03 years ago, making it older than 92.92% of listed US stocks we're tracking.
- Equity multiplier, or assets relative to shareholders' equity, comes in at 14.27 for AMGEN INC; that's greater than it is for 95.78% of US stocks.
- Stocks that are quantitatively similar to AMGN, based on their financial statements, market capitalization, and price volatility, are PFE, TXN, NFLX, GILD, and CSCO.
- Visit AMGN's SEC page to see the company's official filings. To visit the company's web site, go to www.amgen.com.
AMGN Valuation Summary
- In comparison to the median Healthcare stock, AMGN's price/sales ratio is 35.71% higher, now standing at 5.7.
- AMGN's price/sales ratio has moved down 4.8 over the prior 243 months.
Below are key valuation metrics over time for AMGN.
Stock | Date | P/S | P/B | P/E | EV/EBIT |
---|---|---|---|---|---|
AMGN | 2023-12-29 | 5.7 | 20.1 | 20.4 | 16.0 |
AMGN | 2023-12-28 | 5.8 | 20.2 | 20.4 | 16.1 |
AMGN | 2023-12-27 | 5.7 | 20.0 | 20.3 | 16.0 |
AMGN | 2023-12-26 | 5.7 | 19.8 | 20.1 | 15.8 |
AMGN | 2023-12-22 | 5.7 | 19.9 | 20.1 | 15.8 |
AMGN | 2023-12-21 | 5.6 | 19.5 | 19.8 | 15.6 |
AMGN Growth Metrics
- The 3 year revenue growth rate now stands at 10.8%.
- The 3 year net cashflow from operations growth rate now stands at -10.5%.
- Its 2 year revenue growth rate is now at 9.81%.
The table below shows AMGN's growth in key financial areas (numbers in millions of US dollars).
Date | Revenue | Operating Cash Flow | Net Income to Common Stock |
---|---|---|---|
2022-12-31 | 26,323 | 9,721 | 6,552 |
2022-09-30 | 26,330 | 9,880 | 6,835 |
2022-06-30 | 26,384 | 9,320 | 6,576 |
2022-03-31 | 26,316 | 9,321 | 5,723 |
2021-12-31 | 25,979 | 9,261 | 5,893 |
2021-09-30 | 25,767 | 8,606 | 5,609 |
AMGN's Quality Factors
The “Quality” component of the POWR Ratings focuses on 31 different factors of a companies fundamentals and operational strength. Here are some key insights as we drill into the specifics of these quality attributes.- AMGN has a Quality Grade of A, ranking ahead of 98.04% of graded US stocks.
- AMGN's asset turnover comes in at 0.412 -- ranking 113th of 682 Pharmaceutical Products stocks.
- UTHR, NBY, and AERI are the stocks whose asset turnover ratios are most correlated with AMGN.
The table below shows AMGN's key quality metrics over time.
Period | Asset Turnover | Gross Margin | ROIC |
---|---|---|---|
2021-09-30 | 0.412 | 0.754 | 0.169 |
2021-06-30 | 0.408 | 0.753 | 0.169 |
2021-03-31 | 0.395 | 0.756 | 0.196 |
2020-12-31 | 0.400 | 0.758 | 0.206 |
2020-09-30 | 0.398 | 0.767 | 0.220 |
2020-06-30 | 0.395 | 0.782 | 0.225 |
AMGN Price Target
For more insight on analysts targets of AMGN, see our AMGN price target page. And for a list of of all stocks sorted by upside potential based on analyst target price, see our Top Price Target page.
Average Price Target | $250.00 | Average Broker Recommendation | 1.78 (Moderate Buy) |
Amgen Inc. (AMGN) Company Bio
Amgen Inc. (formerly Applied Molecular Genetics Inc.) is an American multinational biopharmaceutical company headquartered in Thousand Oaks, California. One of the world's largest independent biotechnology companies, Amgen was established in Thousand Oaks, California, in 1980. Amgen's Thousand Oaks staff in 2017 numbered 5,125 (7.5% of total city employment) and included hundreds of scientists, making Amgen the largest employer in Ventura County. Focused on molecular biology and biochemistry, its goal is to provide a healthcare business based on recombinant DNA technology. (Source:Wikipedia)
Latest AMGN News From Around the Web
Below are the latest news stories about AMGEN INC that investors may wish to consider to help them evaluate AMGN as an investment opportunity.
Coherus (CHRS) Stock Rallies on FDA Nod for Udenyca OnbodyThe FDA approves Coherus' (CHRS) Udenyca Onbody, an on-body injector presentation of Udenyca (pegfilgrastim-cbqv). Shares of the company rise on the news. |
Biotech Stock Roundup: BMY's KRTX and RYZB Acquisition, CYTK Surges on Study DataBristol Myers (BMY) and Cytokinetics (CYTK) are in the news on acquisition announcements and study updates, respectively. |
Amgen (AMGN) Surpasses Market Returns: Some Facts Worth KnowingIn the latest trading session, Amgen (AMGN) closed at $286.53, marking a +0.93% move from the previous day. |
FDA Rejects Amgen's (AMGN) NDA Seeking Full Nod for LumakrasPer the FDA, Amgen (AMGN) will need to complete an additional confirmatory study on Lumakras in certain lung cancer patients before February 2028 to secure full approval. |
FDA Wants Another Amgen Study on LumakrasAmgen will need to run another confirmatory study to win full FDA approval of its lung-cancer drug Lumakras. Amgen says the FDA, which granted conditional approval to the drug in 2021, has turned away its application seeking full approval and called on the company to complete the additional study by February 2028. An FDA advisory panel in October raised issues with Amgen's previous confirmatory study, citing problems with how the study was conducted, its small size and relatively minor extension of the time that patients lived without their cancers getting worse. |
AMGN Price Returns
1-mo | 2.09% |
3-mo | -0.51% |
6-mo | 7.45% |
1-year | 21.93% |
3-year | 22.75% |
5-year | 74.39% |
YTD | -0.51% |
2023 | 13.46% |
2022 | 20.43% |
2021 | 0.87% |
2020 | -1.99% |
2019 | 27.60% |
AMGN Dividends
Ex-Dividend Date | Type | Payout Amount | Change | ||||||
---|---|---|---|---|---|---|---|---|---|
Loading, please wait... |
Continue Researching AMGN
Want to see what other sources are saying about Amgen Inc's financials and stock price? Try the links below:Amgen Inc (AMGN) Stock Price | Nasdaq
Amgen Inc (AMGN) Stock Quote, History and News - Yahoo Finance
Amgen Inc (AMGN) Stock Price and Basic Information | MarketWatch
Loading social stream, please wait...