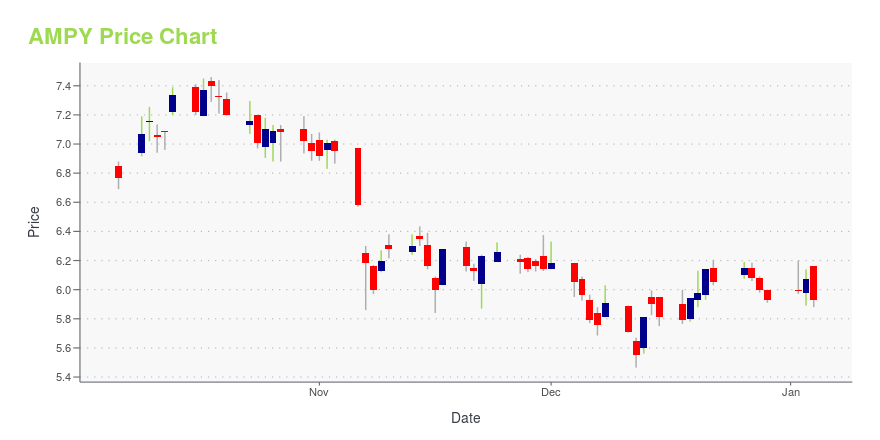
Amplify Energy Corp. (AMPY): Price and Financial Metrics
AMPY Price/Volume Stats
| Current price | $5.75 | 52-week high | $8.15 |
| Prev. close | $5.71 | 52-week low | $3.56 |
| Day low | $5.71 | Volume | 104,183 |
| Day high | $5.84 | Avg. volume | 445,632 |
| 50-day MA | $6.54 | Dividend yield | N/A |
| 200-day MA | $6.68 | Market Cap | 228.68M |
AMPY Stock Price Chart Interactive Chart >
Amplify Energy Corp. (AMPY) Company Bio
Amplify Energy Corp. engages in the acquisition, development, exploitation, and production of oil and natural gas properties in the United States. The company's properties consist of operated and non-operated working interests in producing and undeveloped leasehold acreage, as well as working interests in identified producing wells located in Oklahoma, the Rockies, federal waters offshore Southern California, East Texas/North Louisiana, and South Texas. As of December 31, 2019, it had total estimated proved reserves of approximately 163.0 million barrels of oil equivalent; and 2,643 gross wells. Amplify Energy Corp. was founded in 2011 and is based in Houston, Texas.
AMPY Price Returns
| 1-mo | -17.03% |
| 3-mo | -12.75% |
| 6-mo | -13.53% |
| 1-year | -4.96% |
| 3-year | N/A |
| 5-year | -5.21% |
| YTD | -3.04% |
| 2023 | -32.54% |
| 2022 | 182.64% |
| 2021 | 137.40% |
| 2020 | -77.85% |
| 2019 | -5.47% |
Continue Researching AMPY
Want to see what other sources are saying about Amplify Energy Corp's financials and stock price? Try the links below:Amplify Energy Corp (AMPY) Stock Price | Nasdaq
Amplify Energy Corp (AMPY) Stock Quote, History and News - Yahoo Finance
Amplify Energy Corp (AMPY) Stock Price and Basic Information | MarketWatch


Loading social stream, please wait...