CVS Health Corporation (CVS): Price and Financial Metrics
GET POWR RATINGS... FREE!
CVS POWR Grades
- CVS scores best on the Growth dimension, with a Growth rank ahead of 95.65% of US stocks.
- CVS's strongest trending metric is Stability; it's been moving down over the last 179 days.
- CVS's current lowest rank is in the Momentum metric (where it is better than 33.13% of US stocks).
CVS Stock Summary
- CVS HEALTH CORP's market capitalization of $115,918,160,977 is ahead of 98.06% of US-listed equities.
- CVS HEALTH CORP's stock had its IPO on January 1, 1986, making it an older stock than 93.48% of US equities in our set.
- The volatility of CVS HEALTH CORP's share price is greater than that of only 3.9% US stocks with at least 200 days of trading history.
- Stocks with similar financial metrics, market capitalization, and price volatility to CVS HEALTH CORP are AXP, SONY, CI, EL, and BKNG.
- CVS's SEC filings can be seen here. And to visit CVS HEALTH CORP's official web site, go to www.cvshealth.com.
CVS Valuation Summary
- In comparison to the median Healthcare stock, CVS's price/earnings ratio is 64.25% higher, now standing at 36.3.
- Over the past 243 months, CVS's price/earnings ratio has gone up 9.9.
Below are key valuation metrics over time for CVS.
Stock | Date | P/S | P/B | P/E | EV/EBIT |
---|---|---|---|---|---|
CVS | 2023-01-30 | 0.4 | 1.6 | 36.3 | 26.2 |
CVS | 2023-01-27 | 0.4 | 1.6 | 36.6 | 26.3 |
CVS | 2023-01-26 | 0.4 | 1.6 | 36.5 | 26.3 |
CVS | 2023-01-25 | 0.4 | 1.6 | 35.7 | 25.9 |
CVS | 2023-01-24 | 0.4 | 1.6 | 35.8 | 26.0 |
CVS | 2023-01-23 | 0.4 | 1.6 | 36.3 | 26.2 |
CVS Growth Metrics
- The 3 year net income to common stockholders growth rate now stands at 4777.78%.
- The year over year price growth rate now stands at 23.98%.
- Its 5 year cash and equivalents growth rate is now at 354.71%.

The table below shows CVS's growth in key financial areas (numbers in millions of US dollars).
Date | Revenue | Operating Cash Flow | Net Income to Common Stock |
---|---|---|---|
2022-09-30 | 315,225 | 22,134 | 3,153 |
2022-06-30 | 307,860 | 18,532 | 8,167 |
2022-03-31 | 299,840 | 18,936 | 7,999 |
2021-12-31 | 292,111 | 18,265 | 7,910 |
2021-09-30 | 285,061 | 17,827 | 7,577 |
2021-06-30 | 278,323 | 14,180 | 7,203 |
CVS's Quality Factors
The “Quality” component of the POWR Ratings focuses on 31 different factors of a companies fundamentals and operational strength. Here are some key insights as we drill into the specifics of these quality attributes.- CVS has a Quality Grade of C, ranking ahead of 50.06% of graded US stocks.
- CVS's asset turnover comes in at 1.231 -- ranking 111th of 165 Retail stocks.
- QRTEA, WMT, and TA are the stocks whose asset turnover ratios are most correlated with CVS.
The table below shows CVS's key quality metrics over time.
Period | Asset Turnover | Gross Margin | ROIC |
---|---|---|---|
2021-09-30 | 1.231 | 0.177 | 0.094 |
2021-06-30 | 1.204 | 0.177 | 0.091 |
2021-03-31 | 1.167 | 0.183 | 0.094 |
2020-12-31 | 1.156 | 0.183 | 0.092 |
2020-09-30 | 1.155 | 0.183 | 0.100 |
2020-06-30 | 1.161 | 0.184 | 0.102 |
CVS Price Target
For more insight on analysts targets of CVS, see our CVS price target page. And for a list of of all stocks sorted by upside potential based on analyst target price, see our Top Price Target page.
Average Price Target | $96.11 | Average Broker Recommendation | 1.5 (Moderate Buy) |
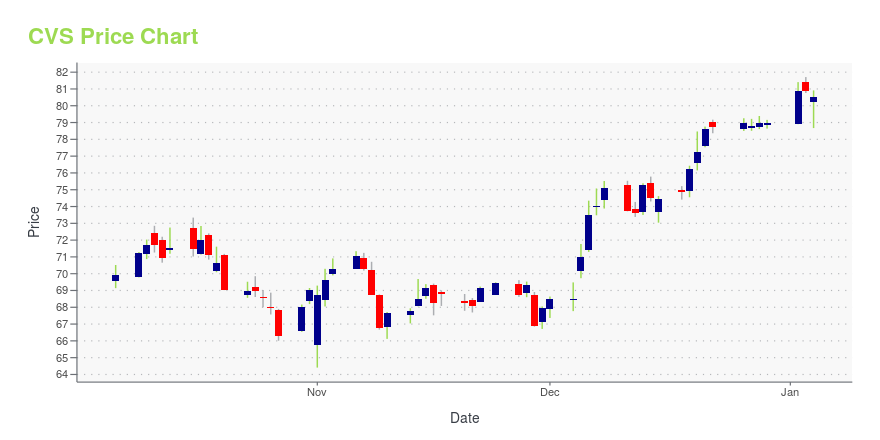
CVS Stock Price Chart Interactive Chart >
CVS Price/Volume Stats
Current price | $87.49 | 52-week high | $111.25 |
Prev. close | $88.22 | 52-week low | $84.82 |
Day low | $86.68 | Volume | 7,420,300 |
Day high | $88.18 | Avg. volume | 10,401,062 |
50-day MA | $94.45 | Dividend yield | 2.74% |
200-day MA | $96.51 | Market Cap | 114.96B |
CVS Health Corporation (CVS) Company Bio
CVS Health Corporation provides integrated pharmacy health care services in the United States. The company operates through Pharmacy Services and Retail Pharmacy segments. The company was founded in 1892 and is based in Woonsocket, Rhode Island.
Latest CVS News From Around the Web
Below are the latest news stories about CVS HEALTH CORP that investors may wish to consider to help them evaluate CVS as an investment opportunity.
CVS Health (CVS) to Expand Health Care Access With New PactCVS Health's (CVS) recent collaboration establishes new Accountable Care that focuses on health equity, coordinated care and enhanced access. |
Zacks Industry Outlook Highlights CVS Health, Walgreens Boots Alliance, Rite Aid and AmazonCVS Health, Walgreens Boots Alliance, Rite Aid and Amazon are part of the Zacks Industry Outlook article. |
Is CVS Health (CVS) a Buy as Wall Street Analysts Look Optimistic?According to the average brokerage recommendation (ABR), one should invest in CVS Health (CVS). It is debatable whether this highly sought-after metric is effective because Wall Street analysts' recommendations tend to be overly optimistic. Would it be worth investing in the stock? |
CVS Health (NYSE:CVS) Has A Pretty Healthy Balance SheetLegendary fund manager Li Lu (who Charlie Munger backed) once said, 'The biggest investment risk is not the volatility... |
3 Retail Pharmacy and Drugstore Stocks to Watch Amid Industry HeadwindsThe Zacks Retail Pharmacy and Drugstore industry players like CVS, WBA and RAD are likely to gain despite reimbursement challenges hurting the overall industry health. |
CVS Price Returns
1-mo | -5.18% |
3-mo | -11.52% |
6-mo | -13.33% |
1-year | -17.72% |
3-year | 41.44% |
5-year | 31.80% |
YTD | -5.47% |
2022 | -7.63% |
2021 | 54.87% |
2020 | -5.14% |
2019 | 17.26% |
2018 | -7.04% |
CVS Dividends
Ex-Dividend Date | Type | Payout Amount | Change | ||||||
---|---|---|---|---|---|---|---|---|---|
Loading, please wait... |
Continue Researching CVS
Want to see what other sources are saying about CVS HEALTH Corp's financials and stock price? Try the links below:CVS HEALTH Corp (CVS) Stock Price | Nasdaq
CVS HEALTH Corp (CVS) Stock Quote, History and News - Yahoo Finance
CVS HEALTH Corp (CVS) Stock Price and Basic Information | MarketWatch
Loading social stream, please wait...