Etsy Inc. (ETSY): Price and Financial Metrics
GET POWR RATINGS... FREE!
ETSY POWR Grades
- ETSY scores best on the Quality dimension, with a Quality rank ahead of 97.11% of US stocks.
- The strongest trend for ETSY is in Growth, which has been heading up over the past 179 days.
- ETSY ranks lowest in Value; there it ranks in the 6th percentile.
ETSY Stock Summary
- The capital turnover (annual revenue relative to shareholder's equity) for ETSY is -4.69 -- better than merely 2.98% of US stocks.
- Equity multiplier, or assets relative to shareholders' equity, comes in at 118.85 for ETSY INC; that's greater than it is for 99.76% of US stocks.
- Over the past twelve months, ETSY has reported earnings growth of -234.53%, putting it ahead of only 6.85% of US stocks in our set.
- Stocks with similar financial metrics, market capitalization, and price volatility to ETSY INC are MSTR, VAPO, RENT, REKR, and JAZZ.
- ETSY's SEC filings can be seen here. And to visit ETSY INC's official web site, go to www.etsy.com.
ETSY Valuation Summary
- In comparison to the median Technology stock, ETSY's price/earnings ratio is 185.23% lower, now standing at -20.2.
- Over the past 97 months, ETSY's price/sales ratio has gone down 11.5.
Below are key valuation metrics over time for ETSY.
Stock | Date | P/S | P/B | P/E | EV/EBIT |
---|---|---|---|---|---|
ETSY | 2023-03-21 | 5.5 | -25.7 | -20.2 | -23.9 |
ETSY | 2023-03-20 | 5.3 | -24.7 | -19.5 | -23.1 |
ETSY | 2023-03-17 | 5.1 | -24.0 | -18.9 | -22.5 |
ETSY | 2023-03-16 | 5.1 | -23.8 | -18.7 | -22.4 |
ETSY | 2023-03-15 | 5.1 | -23.9 | -18.8 | -22.4 |
ETSY | 2023-03-14 | 5.0 | -23.4 | -18.5 | -22.0 |
ETSY Growth Metrics
- Its 3 year cash and equivalents growth rate is now at 116.96%.
- Its 3 year net income to common stockholders growth rate is now at 353.52%.
- Its 2 year net cashflow from operations growth rate is now at 174.29%.

The table below shows ETSY's growth in key financial areas (numbers in millions of US dollars).
Date | Revenue | Operating Cash Flow | Net Income to Common Stock |
---|---|---|---|
2022-12-31 | 2,566.111 | 683.612 | -694.288 |
2022-09-30 | 2,476.009 | 682.321 | -642.279 |
2022-06-30 | 2,413.969 | 566.687 | 410.719 |
2022-03-31 | 2,357.734 | 562.63 | 435.85 |
2021-12-31 | 2,329.114 | 651.551 | 493.507 |
2021-09-30 | 2,229.33 | 604.759 | 480.488 |
ETSY's Quality Factors
The “Quality” component of the POWR Ratings focuses on 31 different factors of a companies fundamentals and operational strength. Here are some key insights as we drill into the specifics of these quality attributes.- ETSY has a Quality Grade of A, ranking ahead of 99.67% of graded US stocks.
- ETSY's asset turnover comes in at 0.763 -- ranking 197th of 563 Business Services stocks.
- TSRI, PCOM, and RRD are the stocks whose asset turnover ratios are most correlated with ETSY.
The table below shows ETSY's key quality metrics over time.
Period | Asset Turnover | Gross Margin | ROIC |
---|---|---|---|
2021-09-30 | 0.763 | 0.733 | 0.222 |
2021-06-30 | 0.826 | 0.738 | 0.265 |
2021-03-31 | 0.923 | 0.744 | 0.350 |
2020-12-31 | 0.874 | 0.731 | 0.283 |
2020-09-30 | 0.783 | 0.706 | 0.194 |
2020-06-30 | 0.712 | 0.686 | 0.142 |
ETSY Price Target
For more insight on analysts targets of ETSY, see our ETSY price target page. And for a list of of all stocks sorted by upside potential based on analyst target price, see our Top Price Target page.
Average Price Target | $221.37 | Average Broker Recommendation | 1.45 (Moderate Buy) |
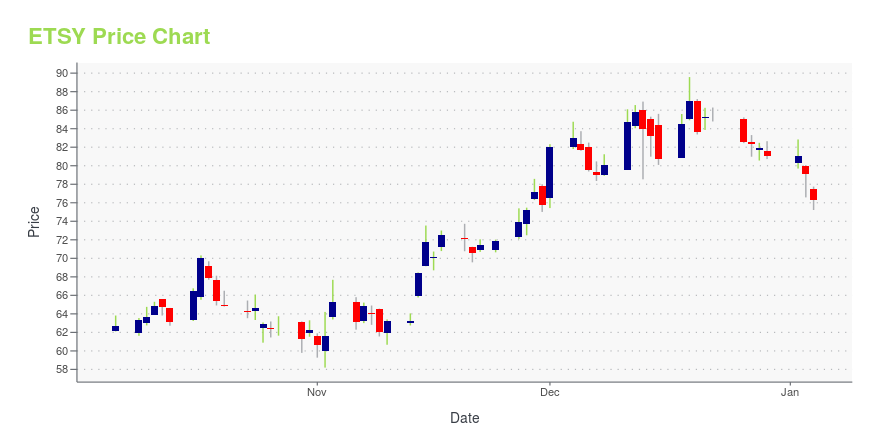
ETSY Stock Price Chart Interactive Chart >
ETSY Price/Volume Stats
Current price | $110.09 | 52-week high | $149.91 |
Prev. close | $110.96 | 52-week low | $67.01 |
Day low | $109.68 | Volume | 3,518,100 |
Day high | $116.15 | Avg. volume | 3,347,170 |
50-day MA | $126.50 | Dividend yield | N/A |
200-day MA | $110.40 | Market Cap | 13.72B |
Etsy Inc. (ETSY) Company Bio
Etsy, Inc. is an American e-commerce company focused on handmade or vintage items and craft supplies. These items fall under a wide range of categories, including jewelry, bags, clothing, home décor and furniture, toys, art, as well as craft supplies and tools. Items described as vintage must be at least 20 years old. The site follows in the tradition of open craft fairs, giving sellers personal storefronts where they list their goods for a fee of US$0.20 per item. (Source:Wikipedia)
Latest ETSY News From Around the Web
Below are the latest news stories about ETSY INC that investors may wish to consider to help them evaluate ETSY as an investment opportunity.
Etsy (ETSY) Stock Sinks As Market Gains: What You Should KnowEtsy (ETSY) closed at $104.43 in the latest trading session, marking a -0.3% move from the prior day. |
There’s a Run on Silicon Valley Bank SwagSilicon Valley Bank has collapsed, but branded company gear such as socks, hats and wine tumblers are selling like crazy. “Own a piece of bank history!” a seller wrote on an eBay Inc. listing for an SVB tumbler. Sellers have cashed in on SVB’s infamy to make money on all sorts of company merch they may have once neglected. |
1 Growth Stock Down 62% to Buy Right NowWith economic uncertainty remaining high, there are opportunities for long-term investors to scoop up great businesses at discounted valuations. As of this writing, Etsy's shares are down 62% from the all-time high they set in November 2021. The company's gross merchandise sales (GMS) of $13.3 billion in 2022 were 166% higher than its pre-pandemic 2019 total of $5 billion. |
What Makes Etsy (ETSY) Special Compared to its Peers?ClearBridge Investments, an investment management firm, published its “Mid Cap Strategy” fourth quarter 2022 investor letter. A copy of which can be downloaded here. During the fourth quarter, the strategy underperformed the Russell Midcap Index. On an absolute basis, the strategy gained in 10 of the 11 sectors it invested in during the quarter. The consumer […] |
A Bull Market Is Coming: 5 Top Stocks to Buy NowWith stock indexes still in the doldrums, you may not be thinking about the next bull market right now. Today, many top stocks with amazing growth prospects are cheap, beaten down by today's tough market. When you think of Moderna (NASDAQ: MRNA), you probably think of the coronavirus vaccine. |
ETSY Price Returns
1-mo | -14.29% |
3-mo | -13.27% |
6-mo | 14.12% |
1-year | -21.90% |
3-year | 188.72% |
5-year | 313.25% |
YTD | -8.09% |
2022 | -45.29% |
2021 | 23.06% |
2020 | 301.60% |
2019 | -6.87% |
2018 | 132.62% |
Continue Researching ETSY
Here are a few links from around the web to help you further your research on Etsy Inc's stock as an investment opportunity:Etsy Inc (ETSY) Stock Price | Nasdaq
Etsy Inc (ETSY) Stock Quote, History and News - Yahoo Finance
Etsy Inc (ETSY) Stock Price and Basic Information | MarketWatch
Loading social stream, please wait...