Expedia Group Inc. (EXPE): Price and Financial Metrics
EXPE Price/Volume Stats
Current price | $137.75 | 52-week high | $160.05 |
Prev. close | $138.99 | 52-week low | $87.94 |
Day low | $137.59 | Volume | 2,081,400 |
Day high | $139.90 | Avg. volume | 2,625,897 |
50-day MA | $140.70 | Dividend yield | N/A |
200-day MA | $123.67 | Market Cap | 18.77B |
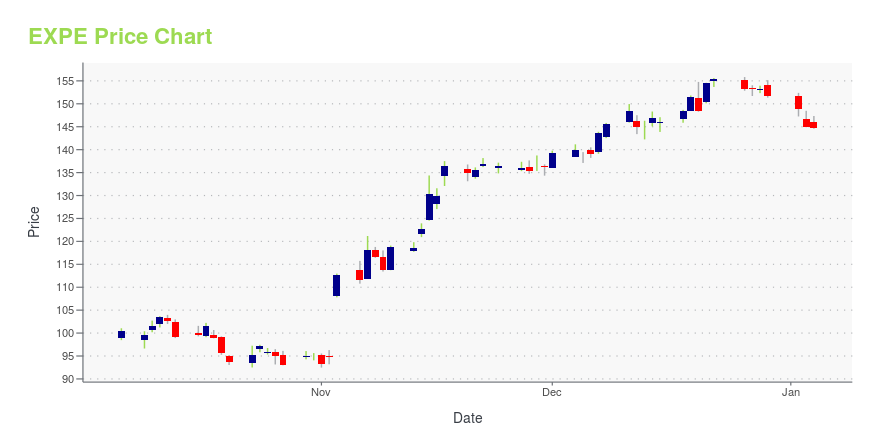
EXPE Stock Price Chart Interactive Chart >
EXPE POWR Grades
- EXPE scores best on the Quality dimension, with a Quality rank ahead of 97.42% of US stocks.
- The strongest trend for EXPE is in Growth, which has been heading down over the past 26 weeks.
- EXPE's current lowest rank is in the Stability metric (where it is better than 11.39% of US stocks).
EXPE Stock Summary
- EXPE has a market capitalization of $20,131,605,158 -- more than approximately 89.28% of US stocks.
- EXPEDIA GROUP INC's capital turnover -- a measure of revenue relative to shareholder's equity -- is better than 94.76% of US listed stocks.
- Equity multiplier, or assets relative to shareholders' equity, comes in at 12.55 for EXPEDIA GROUP INC; that's greater than it is for 94.07% of US stocks.
- Stocks with similar financial metrics, market capitalization, and price volatility to EXPEDIA GROUP INC are ESTA, MAPS, VNT, BAX, and WFRD.
- Visit EXPE's SEC page to see the company's official filings. To visit the company's web site, go to www.expediagroup.com.
EXPE Valuation Summary
- EXPE's price/earnings ratio is 25; this is 10.62% higher than that of the median Industrials stock.
- EXPE's price/sales ratio has moved down 2.8 over the prior 224 months.
Below are key valuation metrics over time for EXPE.
Stock | Date | P/S | P/B | P/E | EV/EBIT |
---|---|---|---|---|---|
EXPE | 2023-12-29 | 1.7 | 12.6 | 25.0 | 15.2 |
EXPE | 2023-12-28 | 1.7 | 12.7 | 25.3 | 15.4 |
EXPE | 2023-12-27 | 1.7 | 12.7 | 25.3 | 15.4 |
EXPE | 2023-12-26 | 1.7 | 12.7 | 25.3 | 15.3 |
EXPE | 2023-12-22 | 1.7 | 12.9 | 25.6 | 15.6 |
EXPE | 2023-12-21 | 1.7 | 12.8 | 25.5 | 15.5 |
EXPE Growth Metrics
- The 5 year revenue growth rate now stands at 28.8%.
- The 3 year cash and equivalents growth rate now stands at 95.79%.
- The 5 year price growth rate now stands at -42.41%.
The table below shows EXPE's growth in key financial areas (numbers in millions of US dollars).
Date | Revenue | Operating Cash Flow | Net Income to Common Stock |
---|---|---|---|
2022-12-31 | 11,667 | 3,440 | 352 |
2022-09-30 | 11,328 | 3,907 | 451 |
2022-06-30 | 10,671 | 3,683 | 331 |
2022-03-31 | 9,601 | 4,569 | 215 |
2021-12-31 | 8,598 | 3,748 | -269 |
2021-09-30 | 7,239 | 3,078 | -957 |
EXPE's Quality Factors
The “Quality” component of the POWR Ratings focuses on 31 different factors of a companies fundamentals and operational strength. Here are some key insights as we drill into the specifics of these quality attributes.- EXPE has a Quality Grade of B, ranking ahead of 83.51% of graded US stocks.
- EXPE's asset turnover comes in at 0.274 -- ranking 73rd of 137 Transportation stocks.
- NCLH, ALK, and CCL are the stocks whose asset turnover ratios are most correlated with EXPE.
The table below shows EXPE's key quality metrics over time.
Period | Asset Turnover | Gross Margin | ROIC |
---|---|---|---|
2021-06-30 | 0.274 | 0.767 | -0.171 |
2021-03-31 | 0.206 | 0.678 | -0.233 |
2020-12-31 | 0.258 | 0.677 | -0.337 |
2020-09-30 | 0.337 | 0.722 | -0.340 |
2020-06-30 | 0.427 | 0.764 | -0.324 |
2020-03-31 | 0.546 | 0.805 | -0.137 |
EXPE Price Target
For more insight on analysts targets of EXPE, see our EXPE price target page. And for a list of of all stocks sorted by upside potential based on analyst target price, see our Top Price Target page.
Average Price Target | $179.93 | Average Broker Recommendation | 1.71 (Moderate Buy) |
Expedia Group Inc. (EXPE) Company Bio
Expedia Group, Inc. is an American online travel shopping company for consumer and small business travel. Its websites, which are primarily travel fare aggregators and travel metasearch engines, include Expedia.com, Vrbo (previously HomeAway), Hotels.com, Hotwire.com, Orbitz, Travelocity, trivago and CarRentals.com. (Source:Wikipedia)
Latest EXPE News From Around the Web
Below are the latest news stories about EXPEDIA GROUP INC that investors may wish to consider to help them evaluate EXPE as an investment opportunity.
Travel and Leisure Titans: 3 Stocks Set to Soar in 2024These travel and leisure stocks are high-quality businesses with robust shareholder return programs that will support more gains in 2024. |
Are Retail-Wholesale Stocks Lagging Abercrombie & Fitch (ANF) This Year?Here is how Abercrombie & Fitch (ANF) and Expedia (EXPE) have performed compared to their sector so far this year. |
3 Stocks That Hedge Funds Are Abandoning in DrovesStructural shifts in the financial markets have led to interesting strategic shifts among hedge fund managers. |
Is Expedia Group (EXPE) Stock Undervalued Right Now?Here at Zacks, our focus is on the proven Zacks Rank system, which emphasizes earnings estimates and estimate revisions to find great stocks. Nevertheless, we are always paying attention to the latest value, growth, and momentum trends to underscore strong picks. |
Expedia (EXPE) Exceeds Market Returns: Some Facts to ConsiderIn the closing of the recent trading day, Expedia (EXPE) stood at $155.31, denoting a +0.51% change from the preceding trading day. |
EXPE Price Returns
1-mo | 1.64% |
3-mo | -9.25% |
6-mo | 33.65% |
1-year | 43.30% |
3-year | -21.68% |
5-year | 17.22% |
YTD | -9.25% |
2023 | 73.28% |
2022 | -51.53% |
2021 | 36.50% |
2020 | 22.89% |
2019 | -2.90% |
Continue Researching EXPE
Want to do more research on Expedia Group Inc's stock and its price? Try the links below:Expedia Group Inc (EXPE) Stock Price | Nasdaq
Expedia Group Inc (EXPE) Stock Quote, History and News - Yahoo Finance
Expedia Group Inc (EXPE) Stock Price and Basic Information | MarketWatch
Loading social stream, please wait...