Jumia Technologies AG ADR (JMIA): Price and Financial Metrics
JMIA Price/Volume Stats
| Current price | $3.21 | 52-week high | $15.04 |
| Prev. close | $3.06 | 52-week low | $1.60 |
| Day low | $3.07 | Volume | 2,134,500 |
| Day high | $3.23 | Avg. volume | 3,235,746 |
| 50-day MA | $2.40 | Dividend yield | N/A |
| 200-day MA | $3.97 | Market Cap | 393.11M |
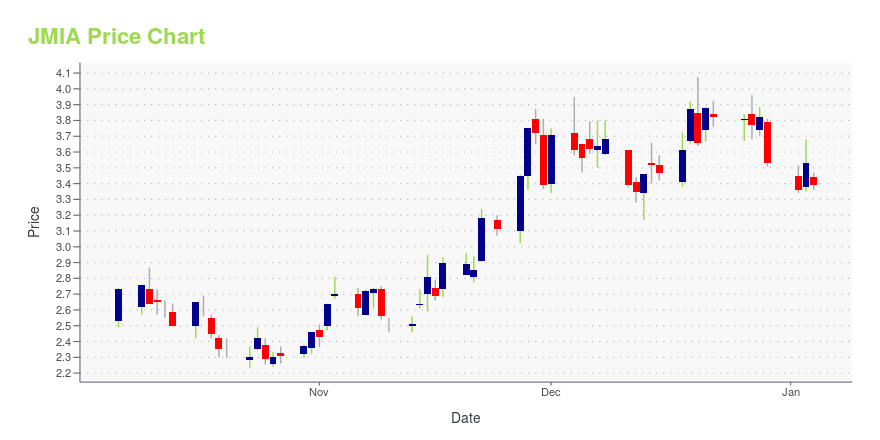
JMIA Stock Price Chart Interactive Chart >
Jumia Technologies AG ADR (JMIA) Company Bio
Jumia Technologies AG engages in the provision of logistic services. It operates though e-Commerce platform segment. The e-Commerce platform segment consists marketplace, which connects sellers with consumers to its logistics service, which enables the shipment and delivery of packages from sellers to consumers, and payment service, which facilitates transactions among participants active on platform in selected markets. The company was founded on June 26, 2012 and is headquartered in Berlin, Germany.
JMIA Price Returns
| 1-mo | 52.86% |
| 3-mo | -22.65% |
| 6-mo | -14.17% |
| 1-year | -52.58% |
| 3-year | -51.80% |
| 5-year | -19.75% |
| YTD | -15.97% |
| 2024 | 8.22% |
| 2023 | 9.97% |
| 2022 | -71.84% |
| 2021 | -71.75% |
| 2020 | 499.55% |


Loading social stream, please wait...