Lyft, Inc. - (LYFT): Price and Financial Metrics
GET POWR RATINGS... FREE!
LYFT POWR Grades
- Growth is the dimension where LYFT ranks best; there it ranks ahead of 90.35% of US stocks.
- LYFT's strongest trending metric is Quality; it's been moving up over the last 179 days.
- LYFT's current lowest rank is in the Stability metric (where it is better than 14.17% of US stocks).
LYFT Stock Summary
- LYFT has a market capitalization of $13,998,062,895 -- more than approximately 84.36% of US stocks.
- Lyft Inc's capital turnover -- a measure of revenue relative to shareholder's equity -- is better than 78.31% of US listed stocks.
- LYFT's went public 3.01 years ago, making it older than merely 9.5% of listed US stocks we're tracking.
- Stocks with similar financial metrics, market capitalization, and price volatility to Lyft Inc are BOX, MDB, TWLO, QLYS, and EB.
- Visit LYFT's SEC page to see the company's official filings. To visit the company's web site, go to www.lyft.com.
LYFT Valuation Summary
- LYFT's price/sales ratio is 6.6; this is 21.1% higher than that of the median Technology stock.
- Over the past 30 months, LYFT's price/earnings ratio has gone up 14.2.
Below are key valuation metrics over time for LYFT.
Stock | Date | P/S | P/B | P/E | EV/EBIT |
---|---|---|---|---|---|
LYFT | 2021-09-01 | 6.6 | 11.9 | -10.2 | -10.7 |
LYFT | 2021-08-31 | 6.5 | 11.7 | -10.0 | -10.5 |
LYFT | 2021-08-30 | 6.5 | 11.6 | -9.9 | -10.4 |
LYFT | 2021-08-27 | 6.6 | 11.9 | -10.2 | -10.7 |
LYFT | 2021-08-26 | 6.7 | 11.9 | -10.2 | -10.8 |
LYFT | 2021-08-25 | 6.8 | 12.1 | -10.4 | -10.9 |
LYFT's Quality Factors
The “Quality” component of the POWR Ratings focuses on 31 different factors of a companies fundamentals and operational strength. Here are some key insights as we drill into the specifics of these quality attributes.- LYFT has a Quality Grade of C, ranking ahead of 57.18% of graded US stocks.
- LYFT's asset turnover comes in at 0.603 -- ranking 268th of 563 Business Services stocks.
- 500 - Internal server error
The table below shows LYFT's key quality metrics over time.
Period | Asset Turnover | Gross Margin | ROIC |
---|---|---|---|
2021-09-30 | 0.603 | 0.460 | -0.459 |
2021-06-30 | 0.521 | 0.422 | -0.569 |
2021-03-31 | 0.416 | 0.347 | -0.626 |
2020-12-31 | 0.463 | 0.388 | -0.648 |
2020-09-30 | 0.524 | 0.446 | -0.613 |
2020-06-30 | 0.588 | 0.426 | -0.630 |
LYFT Price Target
For more insight on analysts targets of LYFT, see our LYFT price target page. And for a list of of all stocks sorted by upside potential based on analyst target price, see our Top Price Target page.
Average Price Target | $69.76 | Average Broker Recommendation | 1.6 (Moderate Buy) |
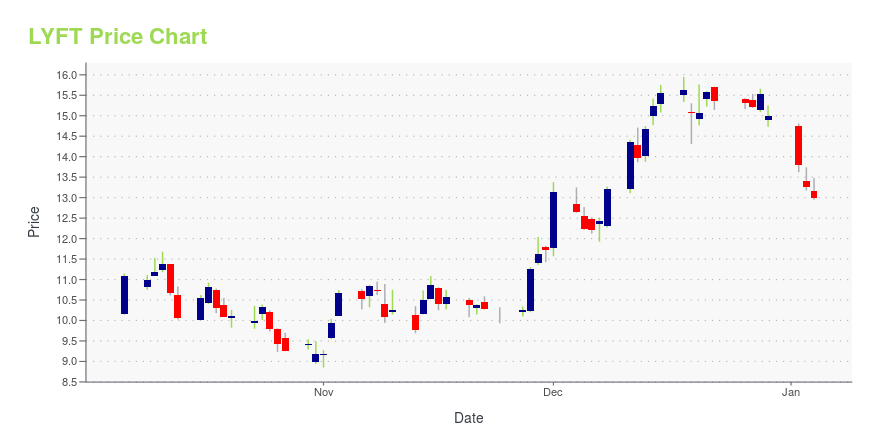
LYFT Stock Price Chart Interactive Chart >
LYFT Price/Volume Stats
Current price | $16.72 | 52-week high | $63.07 |
Prev. close | $20.21 | 52-week low | $16.57 |
Day low | $16.57 | Volume | 17,806,826 |
Day high | $19.79 | Avg. volume | 9,275,379 |
50-day MA | $30.82 | Dividend yield | N/A |
200-day MA | $41.78 | Market Cap | 5.83B |
Lyft, Inc. - (LYFT) Company Bio
Lyft is a transportation network company primarily providing ride-hailing services and based in San Francisco, California. It develops, markets, and operates the Lyft car transportation mobile app.
Latest LYFT News From Around the Web
Below are the latest news stories about Lyft Inc that investors may wish to consider to help them evaluate LYFT as an investment opportunity.
Rising Rates Have Lyft Stock Investors Running ScaredLyft's lack of profitability makes it vulnerable to rising interest rates. |
5 Autonomous Vehicles Stocks to Buy as Nvidia-Jaguar Deal Revs UpSelf-driving cars could be the next big thing on the roads and investors are pouring into autonomous vehicles stocks. |
Lyft Shares Are Ready To Be Lifted Uphttps://www.investing.com/analysis/lyft-shares-are-ready-to-be-lifted-up-200618757 |
Lyft Inc. (LYFT) Shares Are Down -9.01% YTDLyft Inc. (NASDAQ:LYFT) has seen 1.1 million shares traded in the recent trading session. The company, currently valued at $13.94B, closed the recent trade at $38.14 per share which meant it lost -$0.74 on the day or -1.90% during that session. The LYFT stock price is -79.02% off its 52-week high price of $68.28 and … Lyft Inc. (LYFT) Shares Are Down -9.01% YTD Read More » |
Will Ford Surpass Tesla By 2025?I'm assigning Ford Motor Company (NYSE:F) a positive risk/reward rating based on its discounted valuation, long-term technical support, leading market position in trucks, its competitive positioning in SUVs, and its vision for autonomous vehicles. Risk/Reward Rating: Positive To set the stage for the Ford investment case, I will begin by... |
LYFT Price Returns
1-mo | -49.58% |
3-mo | -55.33% |
6-mo | N/A |
1-year | -68.64% |
3-year | -70.72% |
5-year | N/A |
YTD | -60.87% |
2021 | -13.03% |
2020 | 14.20% |
2019 | N/A |
2018 | N/A |
2017 | N/A |
Loading social stream, please wait...