The OLB Group, Inc. (OLB): Price and Financial Metrics
OLB Price/Volume Stats
| Current price | $1.77 | 52-week high | $9.43 |
| Prev. close | $1.75 | 52-week low | $1.36 |
| Day low | $1.72 | Volume | 9,300 |
| Day high | $1.84 | Avg. volume | 17,600 |
| 50-day MA | $1.85 | Dividend yield | N/A |
| 200-day MA | $2.84 | Market Cap | 3.81M |
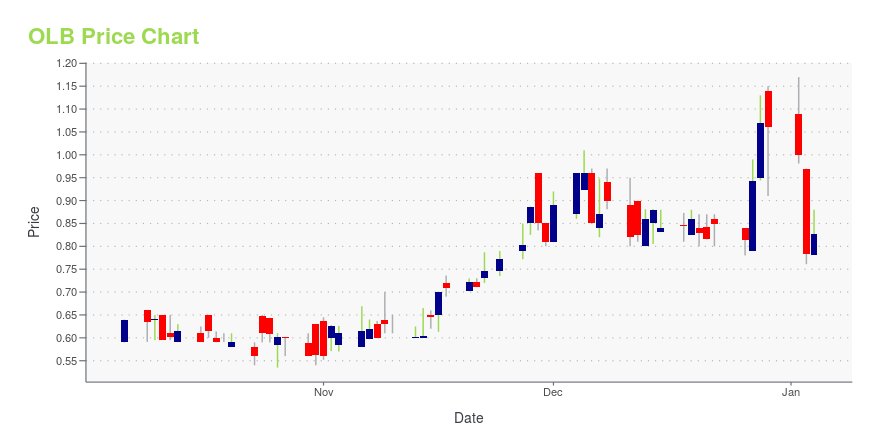
OLB Stock Price Chart Interactive Chart >
The OLB Group, Inc. (OLB) Company Bio
The OLB Group, Inc. develops application software. The Company designs online shopping systems to purchase food and other related things, as well as allows payment services. OLB Group serves customers in the State of New York.
OLB Price Returns
| 1-mo | 5.36% |
| 3-mo | -21.34% |
| 6-mo | -41.00% |
| 1-year | N/A |
| 3-year | -90.38% |
| 5-year | N/A |
| YTD | -14.49% |
| 2024 | -80.47% |
| 2023 | 26.36% |
| 2022 | -68.34% |
| 2021 | -46.36% |
| 2020 | N/A |


Loading social stream, please wait...