Ovintiv Inc. (OVV): Price and Financial Metrics
GET POWR RATINGS... FREE!
OVV POWR Grades
- Value is the dimension where OVV ranks best; there it ranks ahead of 93.38% of US stocks.
- OVV's strongest trending metric is Quality; it's been moving down over the last 179 days.
- OVV's current lowest rank is in the Sentiment metric (where it is better than 17.85% of US stocks).
OVV Stock Summary
- With a price/earnings ratio of 2.31, OVINTIV INC P/E ratio is greater than that of about merely 3.23% of stocks in our set with positive earnings.
- Over the past twelve months, OVV has reported earnings growth of 145.16%, putting it ahead of 90.24% of US stocks in our set.
- Shareholder yield, a measure of how much is returned to shareholders via dividends and share repurchases, for OVV comes in at 27.04% -- higher than that of 93.5% of stocks in our set.
- Stocks with similar financial metrics, market capitalization, and price volatility to OVINTIV INC are TNK, GLBS, APLE, CPA, and VST.
- OVV's SEC filings can be seen here. And to visit OVINTIV INC's official web site, go to www.ovintiv.com.
OVV Valuation Summary
- OVV's price/earnings ratio is 2.3; this is 72.29% lower than that of the median Energy stock.
- OVV's price/sales ratio has moved down 0.8 over the prior 243 months.
Below are key valuation metrics over time for OVV.
Stock | Date | P/S | P/B | P/E | EV/EBIT |
---|---|---|---|---|---|
OVV | 2023-03-20 | 0.7 | 1.1 | 2.3 | 3.3 |
OVV | 2023-03-17 | 0.7 | 1.1 | 2.3 | 3.3 |
OVV | 2023-03-16 | 0.7 | 1.1 | 2.4 | 3.4 |
OVV | 2023-03-15 | 0.7 | 1.1 | 2.2 | 3.2 |
OVV | 2023-03-14 | 0.7 | 1.2 | 2.5 | 3.5 |
OVV | 2023-03-13 | 0.7 | 1.2 | 2.5 | 3.5 |
OVV Growth Metrics
- Its 5 year revenue growth rate is now at 134.95%.
- Its 4 year net income to common stockholders growth rate is now at 771.64%.
- Its 5 year net income to common stockholders growth rate is now at 771.64%.

The table below shows OVV's growth in key financial areas (numbers in millions of US dollars).
Date | Revenue | Operating Cash Flow | Net Income to Common Stock |
---|---|---|---|
2022-12-31 | 12,464 | 3,866 | 3,637 |
2022-09-30 | 12,591 | 3,731 | 3,686 |
2022-06-30 | 10,831 | 3,581 | 2,428 |
2022-03-31 | 8,787 | 2,987 | 866 |
2021-12-31 | 8,658 | 3,129 | 1,416 |
2021-09-30 | 6,847 | 3,108 | -582 |
OVV's Quality Factors
The “Quality” component of the POWR Ratings focuses on 31 different factors of a companies fundamentals and operational strength. Here are some key insights as we drill into the specifics of these quality attributes.- OVV has a Quality Grade of C, ranking ahead of 72.82% of graded US stocks.
- OVV's asset turnover comes in at 0.431 -- ranking 57th of 136 Petroleum and Natural Gas stocks.
- HES, SWN, and GDP are the stocks whose asset turnover ratios are most correlated with OVV.
The table below shows OVV's key quality metrics over time.
Period | Asset Turnover | Gross Margin | ROIC |
---|---|---|---|
2021-06-30 | 0.431 | 0.304 | -0.115 |
2021-03-31 | 0.347 | 0.273 | -0.318 |
2020-12-31 | 0.358 | 0.401 | -0.262 |
2020-09-30 | 0.327 | 0.401 | -0.216 |
2020-06-30 | 0.335 | 0.453 | -0.128 |
2020-03-31 | 0.378 | 0.539 | 0.064 |
OVV Price Target
For more insight on analysts targets of OVV, see our OVV price target page. And for a list of of all stocks sorted by upside potential based on analyst target price, see our Top Price Target page.
Average Price Target | $37.67 | Average Broker Recommendation | 1.61 (Moderate Buy) |
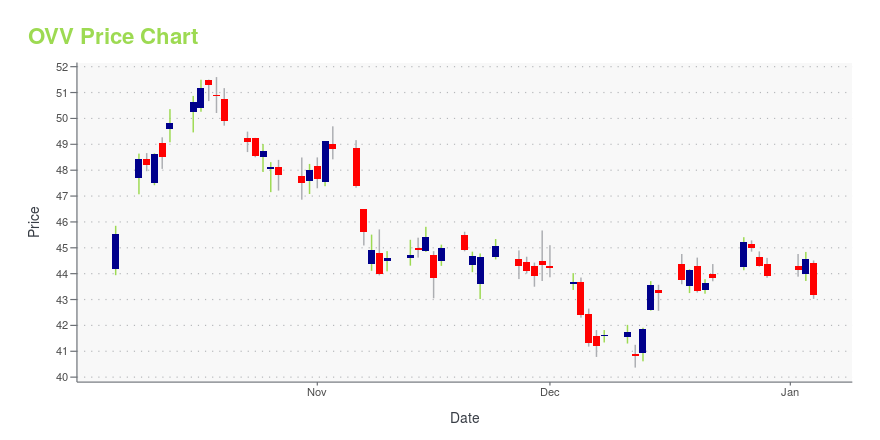
OVV Stock Price Chart Interactive Chart >
OVV Price/Volume Stats
Current price | $33.73 | 52-week high | $63.30 |
Prev. close | $34.18 | 52-week low | $32.26 |
Day low | $32.90 | Volume | 1,501,163 |
Day high | $33.85 | Avg. volume | 3,547,935 |
50-day MA | $44.43 | Dividend yield | 2.9% |
200-day MA | $48.61 | Market Cap | 8.22B |
Ovintiv Inc. (OVV) Company Bio
Ovintiv Inc. operates as an energy producer. The Company focuses on developing its multi-basin portfolio of oil, natural gas liquids, and natural gas producing plays. Ovintiv serves clients in the United States and Canada.
Latest OVV News From Around the Web
Below are the latest news stories about OVINTIV INC that investors may wish to consider to help them evaluate OVV as an investment opportunity.
Ovintiv Inc.'s (TSE:OVV) Stock Has Been Sliding But Fundamentals Look Strong: Is The Market Wrong?Ovintiv (TSE:OVV) has had a rough three months with its share price down 27%. However, stock prices are usually driven... |
Ovintiv's (OVV) Q4 Earnings Miss Estimates, Revenues BeatOvintiv (OVV) expects spending of $2.15-$2.35 billion, crude oil and condensate volumes of 165-175 K bpd and natural gas production of 1,525-1,575 MMcf/d in 2023. |
Ovintiv Inc. (NYSE:OVV) Q4 2022 Earnings Call TranscriptOvintiv Inc. (NYSE:OVV) Q4 2022 Earnings Call Transcript February 28, 2023 Operator: Good morning, ladies and gentlemen, and thank you for standing by. Welcome to Ovintiv’s 2022 Fourth Quarter and Year-End Results Conference Call. Please be advised that this conference call may not be recorded or rebroadcast without the expressed consent of Ovintiv. I would […] |
With EPS Growth And More, Ovintiv (TSE:OVV) Makes An Interesting CaseThe excitement of investing in a company that can reverse its fortunes is a big draw for some speculators, so even... |
Q4 2022 Ovintiv Inc Earnings CallQ4 2022 Ovintiv Inc Earnings Call |
OVV Price Returns
1-mo | -22.48% |
3-mo | -34.65% |
6-mo | -19.94% |
1-year | -34.46% |
3-year | 1,154.74% |
5-year | -33.68% |
YTD | -33.04% |
2022 | 53.29% |
2021 | 137.51% |
2020 | -34.90% |
2019 | -16.03% |
2018 | -56.37% |
OVV Dividends
Ex-Dividend Date | Type | Payout Amount | Change | ||||||
---|---|---|---|---|---|---|---|---|---|
Loading, please wait... |
Loading social stream, please wait...