
Pinterest Inc. (PINS): Price and Financial Metrics
PINS Price/Volume Stats
| Current price | $37.55 | 52-week high | $45.19 |
| Prev. close | $37.88 | 52-week low | $23.59 |
| Day low | $37.45 | Volume | 10,960,499 |
| Day high | $38.59 | Avg. volume | 9,194,684 |
| 50-day MA | $42.28 | Dividend yield | N/A |
| 200-day MA | $36.53 | Market Cap | 25.65B |
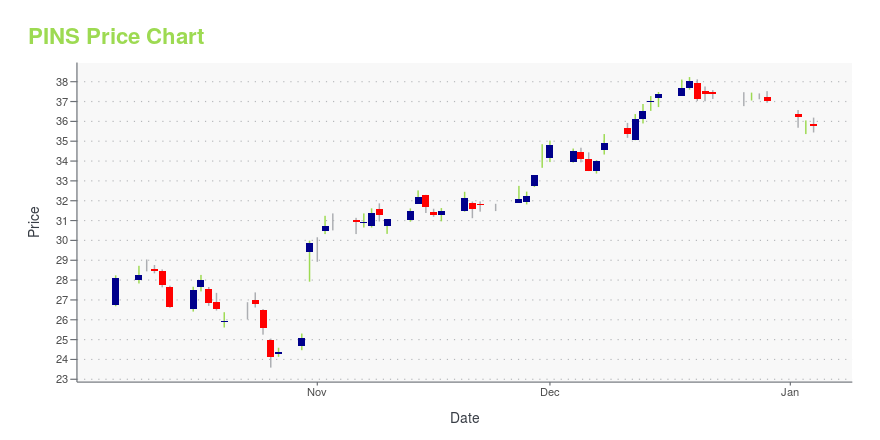
PINS Stock Price Chart Interactive Chart >
Pinterest Inc. (PINS) Company Bio
Pinterest is an image sharing and social media service designed to enable saving and discovery of information (specifically "ideas")on the internet using images, and on a smaller scale, animated GIFs and videos, in the form of pinboards. The site was created by Ben Silbermann, Paul Sciarra, and Evan Sharp, and had 433 million global monthly active users as of July 2022. It is operated by Pinterest, Inc., based in San Francisco. (Source:Wikipedia)
Latest PINS News From Around the Web
Below are the latest news stories about PINTEREST INC that investors may wish to consider to help them evaluate PINS as an investment opportunity.
Growth Galore: 7 Long-Term Stock Picks for Prolonged ProsperityIn the late 1950s, the average holding period for stocks was eight years. |
Pinterest (PINS) Soars 54% YTD: Will This Uptrend Continue?With healthy fundamentals, Pinterest (PINS) appears primed for further appreciation. |
Is it Time to Buy Social Media Stocks Going into 2024?An abundance of tech companies are showing signs of increased profitability amid easing inflation and investors might be wondering if Meta Platforms (META) and other social media operators will continue to benefit as well. |
SNAP vs. PINS: Which Social Media Stock is the Better Buy?In this piece, I evaluated two social media stocks, Snap (NYSE:SNAP) and Pinterest (NYSE:PINS), using TipRanks’ comparison tool to determine which is better. A closer look suggests a bearish view for Snap and a neutral view for Pinterest. Snap is a social media company best known as the parent company of the well-known messaging app Snapchat, while Pinterest is a visual discovery engine that enables users to find ideas like recipes, inspirations for the home and style, and more. Shares of Snap h |
20 Countries That Use Reddit The MostIn this article, we will be taking a look at 20 countries that use Reddit the most. If you want to skip our detailed analysis of the instant messaging market, you can go directly to see 5 Countries That Use Reddit The Most. As a social news website and forum where content is socially curated […] |
PINS Price Returns
| 1-mo | -15.43% |
| 3-mo | 10.57% |
| 6-mo | -0.40% |
| 1-year | 39.80% |
| 3-year | -49.45% |
| 5-year | 35.85% |
| YTD | 1.38% |
| 2023 | 52.55% |
| 2022 | -33.20% |
| 2021 | -44.84% |
| 2020 | 253.54% |
| 2019 | N/A |
Loading social stream, please wait...