Plug Power, Inc. (PLUG): Price and Financial Metrics

Plug Power, Inc. (PLUG): $8.50

-0.27 (-3.08%)

POWR Rating

Component Grades

Momentum

C

Stability

F

Sentiment

Quality

F

Add PLUG to Watchlist
Sign Up

Industry: Industrial - Equipment

Industry

B

Ranked

#84 of 91

in industry

PLUG Price/Volume Stats

Current price $8.50 52-week high $31.56
Prev. close $8.77 52-week low $7.39
Day low $8.49 Volume 3,187,282
Day high $8.87 Avg. volume 19,935,570
50-day MA $9.07 Dividend yield N/A
200-day MA $15.50 Market Cap 5.10B

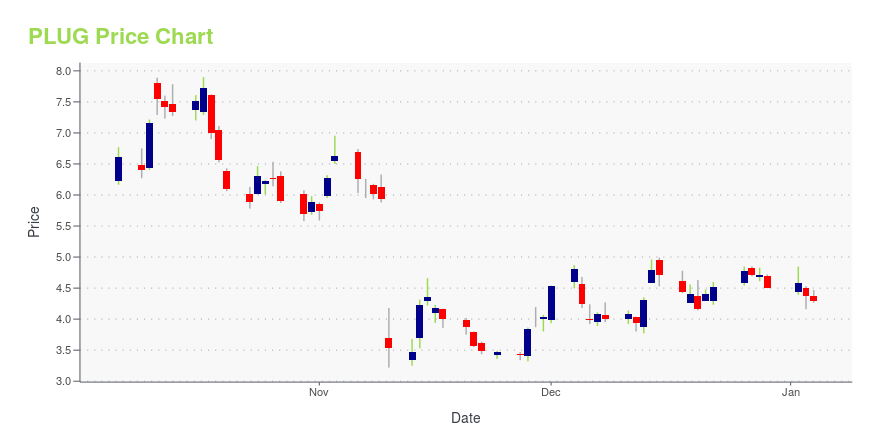
PLUG Stock Price Chart Interactive Chart >

PLUG POWR Grades

  • Growth is the dimension where PLUG ranks best; there it ranks ahead of 58.23% of US stocks.
  • PLUG's strongest trending metric is Quality; it's been moving down over the last 179 days.
  • PLUG's current lowest rank is in the Quality metric (where it is better than 0.98% of US stocks).

PLUG Stock Summary

  • PLUG POWER INC's capital turnover -- a measure of revenue relative to shareholder's equity -- is better than just 17.53% of US listed stocks.
  • PLUG's price/sales ratio is 6.59; that's higher than the P/S ratio of 83.95% of US stocks.
  • In terms of volatility of its share price, PLUG is more volatile than 88.89% of stocks we're observing.
  • If you're looking for stocks that are quantitatively similar to PLUG POWER INC, a group of peers worth examining would be AUID, YOU, MTTR, LOCL, and VUZI.
  • Visit PLUG's SEC page to see the company's official filings. To visit the company's web site, go to www.plugpower.com.

PLUG Valuation Summary

  • In comparison to the median Industrials stock, PLUG's EV/EBIT ratio is 136.31% lower, now standing at -5.7.
  • Over the past 243 months, PLUG's price/sales ratio has gone down 20.8.

Below are key valuation metrics over time for PLUG.

Stock Date P/S P/B P/E EV/EBIT
PLUG 2023-05-19 6.0 1.2 -6.0 -5.7
PLUG 2023-05-18 6.1 1.2 -6.1 -5.8
PLUG 2023-05-17 6.3 1.2 -6.2 -6.0
PLUG 2023-05-16 5.9 1.2 -5.9 -5.6
PLUG 2023-05-15 6.1 1.2 -6.1 -5.8
PLUG 2023-05-12 5.8 1.1 -5.8 -5.5

PLUG Growth Metrics

    The year over year price growth rate now stands at -51.12%.
  • Its year over year cash and equivalents growth rate is now at -32.27%.
  • The 4 year net income to common stockholders growth rate now stands at -27.47%.
PLUG's revenue has moved up $412,365,000 over the prior 33 months.

The table below shows PLUG's growth in key financial areas (numbers in millions of US dollars).

Date Revenue Operating Cash Flow Net Income to Common Stock
2022-09-30 642.604 -531.724 -693.457
2022-06-30 597.898 -516.654 -629.37
2022-03-31 571.188 -450.996 -555.708
2021-12-31 502.342 -358.176 -459.965
2021-09-30 31.328 -347.067 -777.699
2021-06-30 -5.605 -290.864 -710.407

PLUG's Quality Factors

The “Quality” component of the POWR Ratings focuses on 31 different factors of a companies fundamentals and operational strength. Here are some key insights as we drill into the specifics of these quality attributes.
  • PLUG has a Quality Grade of F, ranking ahead of 3.21% of graded US stocks.
  • PLUG's asset turnover comes in at -0.001 -- ranking 53rd of 53 Electrical Equipment stocks.
  • EMR, CCF, and WWD are the stocks whose asset turnover ratios are most correlated with PLUG.

The table below shows PLUG's key quality metrics over time.

Period Asset Turnover Gross Margin ROIC
2021-06-30 -0.001 93.219 -0.448
2021-03-31 -0.024 7.684 -0.538
2020-12-31 -0.067 5.035 -0.605
2020-09-30 0.310 0.059 -0.075
2020-06-30 0.339 0.096 -0.065
2020-03-31 0.399 0.120 -0.071

PLUG Price Target

For more insight on analysts targets of PLUG, see our PLUG price target page. And for a list of of all stocks sorted by upside potential based on analyst target price, see our Top Price Target page.

Average Price Target $43.06 Average Broker Recommendation 1.52 (Moderate Buy)

Plug Power, Inc. (PLUG) Company Bio


Plug Power Inc provides alternative energy technology. It is engaged in the design, development, commercialization, and manufacture of hydrogen fuel cell systems used for the industrial off-road market and the stationary power market. Some of the company’s more recognizable customers include Amazon, BMW, The Southern Company, Carrefour, and WalMart. Plug Power has recently expanded its offerings to serve the zero-emission vehicle, robotics, and data center markets. The company is headquartered in Latham, New York and has offices in Washington D.C. and the Netherlands. Plug Power expanded it’s workforce in the last year for a current total of over 800 employees. The company’s Chief Executive Officer is Andrew J. Marsh.


PLUG Latest News Stream


Event/Time News Detail
Loading, please wait...

PLUG Latest Social Stream


Loading social stream, please wait...

View Full PLUG Social Stream

Latest PLUG News From Around the Web

Below are the latest news stories about PLUG POWER INC that investors may wish to consider to help them evaluate PLUG as an investment opportunity.

5 Meme Stocks to Sell Immediately

Retail investors are wising up to these meme stocks to sell and bailing out quickly.

Thomas Yeung on InvestorPlace | May 31, 2023

Here is What to Know Beyond Why Plug Power, Inc. (PLUG) is a Trending Stock

Recently, Zacks.com users have been paying close attention to Plug Power (PLUG). This makes it worthwhile to examine what the stock has in store.

Yahoo | May 31, 2023

NVDA Stock Alert: Nvidia Nears $1 Trillion Valuation

Nvidia (NVDA) stock is a hot topic among traders on Tuesday as they prepare for the company to reach a $1 trillion valuation.

William White on InvestorPlace | May 30, 2023

PLUG Stock Alert: Plug Power Announces New Plants in Finland

Plug Power (PLUG) stock is climbing higher on Tuesday with investors reacting to its three new plants coming to Finland.

William White on InvestorPlace | May 30, 2023

Why Is ChargePoint (CHPT) Stock Up 11% Today?

ChargePoint (CHPT) stock is getting a boost on Tuesday after the company's shares were upgraded by Bank of America analyst Alex Vrabel.

William White on InvestorPlace | May 30, 2023

Read More 'PLUG' Stories Here

PLUG Price Returns

1-mo -8.50%
3-mo -36.57%
6-mo -37.87%
1-year -52.51%
3-year 74.18%
5-year 356.99%
YTD -31.29%
2022 -56.18%
2021 -16.75%
2020 973.10%
2019 154.84%
2018 -47.46%

Get Free Updates

Join thousands of investors who get the latest news, insights and top rated picks from StockNews.com!