Rivian Automotive Inc. Cl A (RIVN): Price and Financial Metrics
RIVN Price/Volume Stats
Current price | $14.34 | 52-week high | $40.86 |
Prev. close | $14.48 | 52-week low | $11.68 |
Day low | $14.02 | Volume | 17,602,000 |
Day high | $14.67 | Avg. volume | 28,140,742 |
50-day MA | $13.74 | Dividend yield | N/A |
200-day MA | $22.90 | Market Cap | 13.21B |
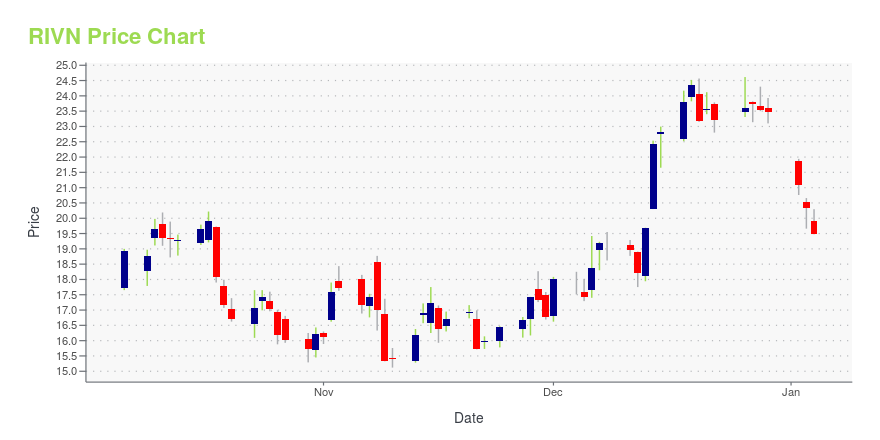
RIVN Stock Price Chart Interactive Chart >
RIVN POWR Grades
- RIVN scores best on the Momentum dimension, with a Momentum rank ahead of 73.38% of US stocks.
- RIVN's strongest trending metric is Growth; it's been moving up over the last 179 days.
- RIVN's current lowest rank is in the Stability metric (where it is better than 1.22% of US stocks).
RIVN Stock Summary
- RIVN's one year PEG ratio, measuring expected growth in earnings next year relative to current common stock price is 0.47 -- higher than merely 5.47% of US-listed equities with positive expected earnings growth.
- RIVN's went public 1.54 years ago, making it older than merely 1.75% of listed US stocks we're tracking.
- As for revenue growth, note that RIVN's revenue has grown 332.69% over the past 12 months; that beats the revenue growth of 97.64% of US companies in our set.
- Stocks that are quantitatively similar to RIVN, based on their financial statements, market capitalization, and price volatility, are PACB, LCID, DCTH, CLXT, and TUYA.
- To check out RIVIAN AUTOMOTIVE INC's SEC filings, go to the company's page on browse-edgar?action=getcompany&CIK=0001874178.
RIVN Valuation Summary
- RIVN's price/earnings ratio is -1.9; this is 114.18% lower than that of the median Consumer Cyclical stock.
- Over the past 18 months, RIVN's price/sales ratio has gone NA NA.
Below are key valuation metrics over time for RIVN.
Stock | Date | P/S | P/B | P/E | EV/EBIT |
---|---|---|---|---|---|
RIVN | 2023-05-19 | 5.7 | 1 | -1.9 | -0.7 |
RIVN | 2023-05-18 | 5.7 | 1 | -2.0 | -0.7 |
RIVN | 2023-05-17 | 5.7 | 1 | -1.9 | -0.7 |
RIVN | 2023-05-16 | 5.5 | 1 | -1.9 | -0.7 |
RIVN | 2023-05-15 | 5.7 | 1 | -1.9 | -0.7 |
RIVN | 2023-05-12 | 5.5 | 1 | -1.9 | -0.7 |
Rivian Automotive Inc. Cl A (RIVN) Company Bio
Rivian is an American electric vehicle automaker and automotive technology company founded in 2009. The company, based in Irvine, CA, is considered one of the more serious rivals to Tesla (TSLA), the leading EV manufacturer.
Latest RIVN News From Around the Web
Below are the latest news stories about RIVIAN AUTOMOTIVE INC that investors may wish to consider to help them evaluate RIVN as an investment opportunity.
UPDATE 2-Surf Air Mobility reveals revenue surge in listing paperworkSurf Air Mobility's revenue for a unit jumped nearly 72% in 2022, showed the electric aviation and regional air travel company's regulatory filing on Monday with the U.S. Securities and Exchange Commission to list its shares in New York. The company, which had confidentially filed for a direct U.S. listing in November, said its unit Surf Air generated $20.27 million in revenue for the year ended Dec. 31, compared with $11.8 million a year earlier. The listing comes at a challenging time for the U.S. public markets as dealmaking has been at a near standstill since last year, with investors grappling with heightened volatility in a rising interest rate environment. |
Why Tesla and Rivian Soared, but Nikola Plunged, in MayMay was a good month for growth and technology stocks. In fact, Tesla (NASDAQ: TSLA) and Rivian Automotive (NASDAQ: RIVN) far outpaced the index itself, soaring by 24.1% and 14.9%, respectively, according to data from S&P Global Market Intelligence. Investors have some specific, and serious, concerns with Nikola (NASDAQ: NKLA) -- maker of electric semi-trucks. |
RIVN Stock Alert: Is the Nasdaq-100 About to Oust Rivian?Shares of RIVN stock could be removed from the Nasdaq 100 Index as soon as this month, according to JPMorgan Chase analyst Min Moon. |
3 Stocks to Make a Fortune in the Age of AIAI is making people's lives easier and giving investors many opportunities. |
Don’t Be Surprised if Rivian Stock Drives Into Single DigitsUntil more suggests RIVN stock can avoid running out of range/keep rolling backwards downhill, consider it wise to keep staying away. |
RIVN Price Returns
1-mo | 6.94% |
3-mo | -5.22% |
6-mo | -49.83% |
1-year | -50.52% |
3-year | N/A |
5-year | N/A |
YTD | -22.19% |
2022 | -82.23% |
2021 | N/A |
2020 | N/A |
2019 | N/A |
2018 | N/A |
Loading social stream, please wait...