Schrodinger Inc. (SDGR): Price and Financial Metrics
SDGR Price/Volume Stats
| Current price | $22.01 | 52-week high | $38.00 |
| Prev. close | $21.46 | 52-week low | $16.67 |
| Day low | $21.60 | Volume | 448,600 |
| Day high | $22.19 | Avg. volume | 763,032 |
| 50-day MA | $18.76 | Dividend yield | N/A |
| 200-day MA | $22.05 | Market Cap | 1.60B |
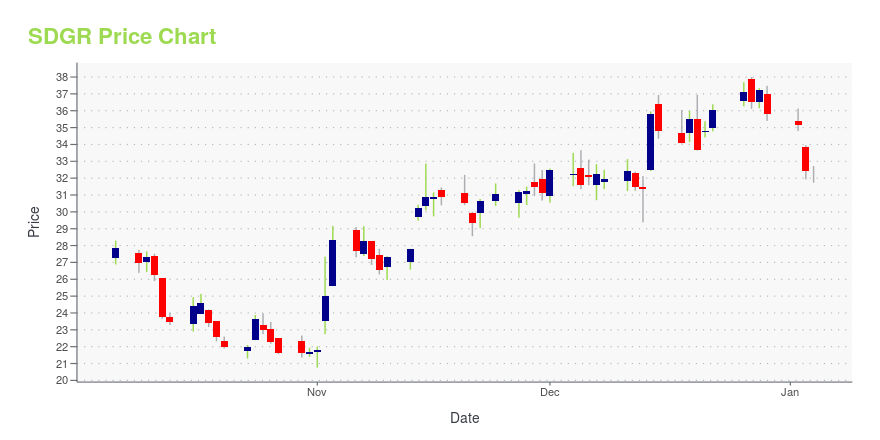
SDGR Stock Price Chart Interactive Chart >
Schrodinger Inc. (SDGR) Company Bio
Schrödinger, Inc. provides chemical simulation software solutions to pharmaceutical industry. It operates through the Software and Drug Discovery business segments. The Software segment sells software to transform drug discovery across the life sciences industry, as well as to customers in materials science industries. The Drug Discovery segment offers diverse portfolio of preclinical and clinical programs, internally and through collaborations, that have advanced to various stages of discovery and development
SDGR Price Returns
| 1-mo | 25.20% |
| 3-mo | 4.66% |
| 6-mo | 2.28% |
| 1-year | -29.21% |
| 3-year | -43.82% |
| 5-year | N/A |
| YTD | -38.52% |
| 2023 | 91.55% |
| 2022 | -46.34% |
| 2021 | -56.01% |
| 2020 | N/A |
| 2019 | N/A |


Loading social stream, please wait...