AT&T Inc. (T): Price and Financial Metrics
T Price/Volume Stats
Current price | $17.60 | 52-week high | $19.99 |
Prev. close | $17.55 | 52-week low | $13.43 |
Day low | $17.52 | Volume | 33,461,500 |
Day high | $17.70 | Avg. volume | 38,868,109 |
50-day MA | $17.12 | Dividend yield | 6.48% |
200-day MA | $15.83 | Market Cap | 125.89B |
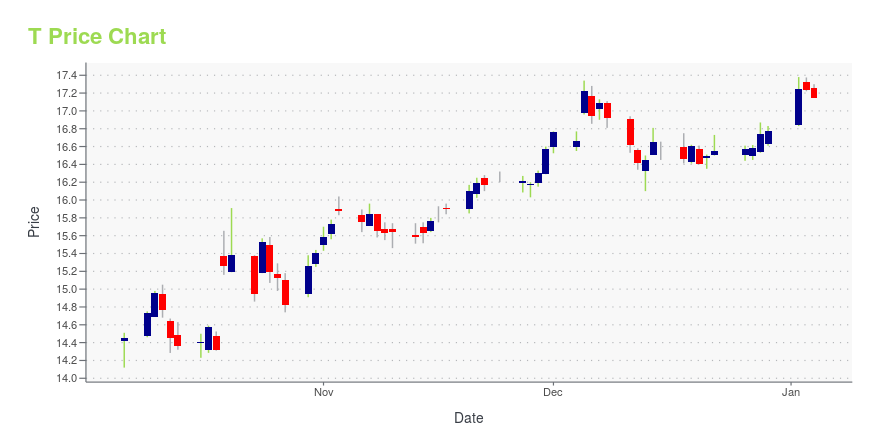
T Stock Price Chart Interactive Chart >
T POWR Grades
- T scores best on the Growth dimension, with a Growth rank ahead of 89.87% of US stocks.
- T's strongest trending metric is Quality; it's been moving down over the last 26 weeks.
- T's current lowest rank is in the Sentiment metric (where it is better than 15.91% of US stocks).
T Stock Summary
- AT&T INC's market capitalization of $123,194,846,633 is ahead of 98.19% of US-listed equities.
- AT&T INC's stock had its IPO on January 1, 1986, making it an older stock than 92.92% of US equities in our set.
- The price/operating cash flow metric for AT&T INC is higher than only 10.85% of stocks in our set with a positive cash flow.
- If you're looking for stocks that are quantitatively similar to AT&T INC, a group of peers worth examining would be CB, BP, UNP, DEO, and UPS.
- T's SEC filings can be seen here. And to visit AT&T INC's official web site, go to www.att.com.
T Valuation Summary
- In comparison to the median Communication Services stock, T's price/sales ratio is 9.09% lower, now standing at 1.
- Over the past 243 months, T's price/earnings ratio has gone down 19.6.
Below are key valuation metrics over time for T.
Stock | Date | P/S | P/B | P/E | EV/EBIT |
---|---|---|---|---|---|
T | 2023-12-29 | 1 | 1.2 | -10.4 | -275.6 |
T | 2023-12-28 | 1 | 1.2 | -10.4 | -275.3 |
T | 2023-12-27 | 1 | 1.1 | -10.3 | -274.1 |
T | 2023-12-26 | 1 | 1.1 | -10.3 | -274.1 |
T | 2023-12-22 | 1 | 1.1 | -10.3 | -273.9 |
T | 2023-12-21 | 1 | 1.1 | -10.2 | -273.5 |
T Growth Metrics
- Its 4 year revenue growth rate is now at 10.16%.
- Its 4 year cash and equivalents growth rate is now at -33.12%.
- The 3 year price growth rate now stands at -36.69%.
The table below shows T's growth in key financial areas (numbers in millions of US dollars).
Date | Revenue | Operating Cash Flow | Net Income to Common Stock |
---|---|---|---|
2022-12-31 | 120,741 | 32,023 | -8,727 |
2022-09-30 | 138,749 | 32,964 | 19,836 |
2022-06-30 | 148,628 | 32,759 | 19,727 |
2022-03-31 | 163,030 | 37,762 | 17,136 |
2021-12-31 | 168,864 | 41,957 | 19,874 |
2021-09-30 | 173,597 | 40,785 | 944 |
T's Quality Factors
The “Quality” component of the POWR Ratings focuses on 31 different factors of a companies fundamentals and operational strength. Here are some key insights as we drill into the specifics of these quality attributes.- T has a Quality Grade of C, ranking ahead of 59.57% of graded US stocks.
- T's asset turnover comes in at 0.327 -- ranking 48th of 64 Communication stocks.
- AMCX, GSAT, and CMCSA are the stocks whose asset turnover ratios are most correlated with T.
The table below shows T's key quality metrics over time.
Period | Asset Turnover | Gross Margin | ROIC |
---|---|---|---|
2021-06-30 | 0.327 | 0.517 | 0.019 |
2021-03-31 | 0.320 | 0.527 | 0.020 |
2020-12-31 | 0.318 | 0.535 | 0.010 |
2020-09-30 | 0.317 | 0.538 | 0.062 |
2020-06-30 | 0.319 | 0.542 | 0.064 |
2020-03-31 | 0.327 | 0.538 | 0.072 |
T Price Target
For more insight on analysts targets of T, see our T price target page. And for a list of of all stocks sorted by upside potential based on analyst target price, see our Top Price Target page.
Average Price Target | $31.51 | Average Broker Recommendation | 1.92 (Hold) |
AT&T Inc. (T) Company Bio
AT&T Inc. is an American multinational conglomerate holding company, Delaware-registered but headquartered at Whitacre Tower in Downtown Dallas, Texas. It is the world’s largest telecommunications company, and the second largest provider of mobile telephone services. As of 2020, AT&T was ranked 9th on the Fortune 500 rankings of the largest United States corporations, with revenues of $181 billion. (Source:Wikipedia)
Latest T News From Around the Web
Below are the latest news stories about AT&T INC that investors may wish to consider to help them evaluate T as an investment opportunity.
Income Investing: 7 Stocks to Buy for a Steady ‘Pay Check’ in 2024One of the easiest ways for investors to get paid consistently is with income investing heading into New Year 2024. |
Will My Portfolio’s Top 3 Performing Stocks From 2023 Deliver Again in 2024?This stock expert takes a look at his portfolio's top performing stocks from the last year. |
Quiet Income Kings: 3 Under-the-Radar Dividend Stocks to Buy NowDiscover under-the-radar dividend stocks with our in-depth analysis. |
Financial Freedom: 7 Exceptional High-Yield Stocks for Lasting Passive GainsThe pursuit of financial freedom often conjures up images of dynamic markets, strategic maneuvers, and the allure of high-yield stocks. |
Apple’s Market Maneuvers: Is AAPL Stock a Smart Buy at $193?A ban on the Apple Watch could hit AAPL stock hard as the wearable is the tech stock's second biggest money-maker. |
T Price Returns
1-mo | 3.77% |
3-mo | 6.60% |
6-mo | 21.36% |
1-year | -1.38% |
3-year | -7.24% |
5-year | 3.34% |
YTD | 6.60% |
2023 | -2.73% |
2022 | 5.85% |
2021 | -8.09% |
2020 | -21.37% |
2019 | 45.55% |
T Dividends
Ex-Dividend Date | Type | Payout Amount | Change | ||||||
---|---|---|---|---|---|---|---|---|---|
Loading, please wait... |
Continue Researching T
Want to do more research on At&T Inc's stock and its price? Try the links below:At&T Inc (T) Stock Price | Nasdaq
At&T Inc (T) Stock Quote, History and News - Yahoo Finance
At&T Inc (T) Stock Price and Basic Information | MarketWatch
Loading social stream, please wait...