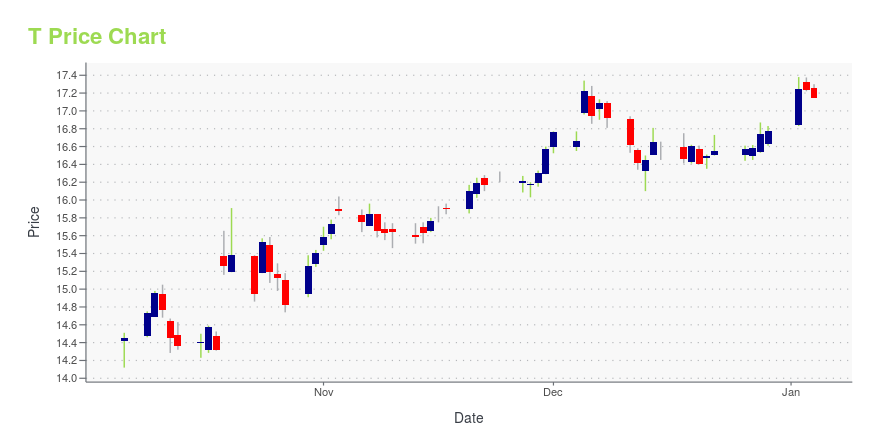
AT&T Inc. (T): Price and Financial Metrics
T Price/Volume Stats
Current price | $15.31 | 52-week high | $20.50 |
Prev. close | $15.55 | 52-week low | $13.43 |
Day low | $15.29 | Volume | 33,709,098 |
Day high | $15.54 | Avg. volume | 39,003,637 |
50-day MA | $14.48 | Dividend yield | 7.3% |
200-day MA | $17.14 | Market Cap | 109.45B |
T Stock Price Chart Interactive Chart >
T POWR Grades
- T scores best on the Momentum dimension, with a Momentum rank ahead of 67.04% of US stocks.
- T's strongest trending metric is Value; it's been moving up over the last 179 days.
- T ranks lowest in Sentiment; there it ranks in the 37th percentile.
T Stock Summary
- T has a market capitalization of $107,878,410,000 -- more than approximately 97.97% of US stocks.
- T's went public 37.74 years ago, making it older than 93.16% of listed US stocks we're tracking.
- The price/operating cash flow metric for AT&T INC is higher than just 10.52% of stocks in our set with a positive cash flow.
- Stocks with similar financial metrics, market capitalization, and price volatility to AT&T INC are CB, DEO, MPC, WM, and SBUX.
- T's SEC filings can be seen here. And to visit AT&T INC's official web site, go to www.att.com.
T Valuation Summary
- In comparison to the median Communication Services stock, T's price/earnings ratio is 173.62% lower, now standing at -12.
- T's EV/EBIT ratio has moved up 237.1 over the prior 243 months.
Below are key valuation metrics over time for T.
Stock | Date | P/S | P/B | P/E | EV/EBIT |
---|---|---|---|---|---|
T | 2023-09-18 | 0.9 | 1.1 | -12.0 | 242.9 |
T | 2023-09-15 | 0.9 | 1.1 | -12.1 | 243.9 |
T | 2023-09-14 | 0.9 | 1.1 | -12.0 | 242.7 |
T | 2023-09-13 | 0.9 | 1.0 | -11.6 | 239.8 |
T | 2023-09-12 | 0.9 | 1.0 | -11.5 | 238.7 |
T | 2023-09-11 | 0.9 | 1.0 | -11.6 | 239.1 |
T Growth Metrics
- Its 4 year revenue growth rate is now at 10.16%.
- Its 4 year cash and equivalents growth rate is now at -33.12%.
- The 3 year price growth rate now stands at -36.69%.

The table below shows T's growth in key financial areas (numbers in millions of US dollars).
Date | Revenue | Operating Cash Flow | Net Income to Common Stock |
---|---|---|---|
2022-12-31 | 120,741 | 32,023 | -8,727 |
2022-09-30 | 138,749 | 32,964 | 19,836 |
2022-06-30 | 148,628 | 32,759 | 19,727 |
2022-03-31 | 163,030 | 37,762 | 17,136 |
2021-12-31 | 168,864 | 41,957 | 19,874 |
2021-09-30 | 173,597 | 40,785 | 944 |
T's Quality Factors
The “Quality” component of the POWR Ratings focuses on 31 different factors of a companies fundamentals and operational strength. Here are some key insights as we drill into the specifics of these quality attributes.- T has a Quality Grade of C, ranking ahead of 59.57% of graded US stocks.
- T's asset turnover comes in at 0.327 -- ranking 48th of 64 Communication stocks.
- AMCX, GSAT, and CMCSA are the stocks whose asset turnover ratios are most correlated with T.
The table below shows T's key quality metrics over time.
Period | Asset Turnover | Gross Margin | ROIC |
---|---|---|---|
2021-06-30 | 0.327 | 0.517 | 0.019 |
2021-03-31 | 0.320 | 0.527 | 0.020 |
2020-12-31 | 0.318 | 0.535 | 0.010 |
2020-09-30 | 0.317 | 0.538 | 0.062 |
2020-06-30 | 0.319 | 0.542 | 0.064 |
2020-03-31 | 0.327 | 0.538 | 0.072 |
T Price Target
For more insight on analysts targets of T, see our T price target page. And for a list of of all stocks sorted by upside potential based on analyst target price, see our Top Price Target page.
Average Price Target | $31.51 | Average Broker Recommendation | 1.92 (Hold) |
AT&T Inc. (T) Company Bio
AT&T Inc. is an American multinational conglomerate holding company, Delaware-registered but headquartered at Whitacre Tower in Downtown Dallas, Texas. It is the world’s largest telecommunications company, and the second largest provider of mobile telephone services. As of 2020, AT&T was ranked 9th on the Fortune 500 rankings of the largest United States corporations, with revenues of $181 billion. (Source:Wikipedia)
Latest T News From Around the Web
Below are the latest news stories about AT&T INC that investors may wish to consider to help them evaluate T as an investment opportunity.
Google vs. DOJ: Breaking down federal prosecutors' antitrust claimsThe Department of Justice’s antitrust lawsuit against Google (GOOG, GOOGL) — accusing the tech giant of unfairly gaining market dominance through its coercive search engine contracts — enters into its second week. Yahoo Finance Legal Reporter Alexis Keenan joins the Live show to dissect the arguments presented by attorneys on both sides, similarities shared between older tech suits, and ultimately assess what a potential outcome to the case would look like. The ongoing case draws comparisons to AT&T’s (T) suit against Google several years ago and the DOJ’s antitrust case made against Microsoft (MSFT) in 2001. |
AT&T Inc (T): A Deep Dive into Its Performance PotentialUnraveling the Factors That Could Limit AT&T Inc's Future Growth |
Nexstar, DirecTV strike distribution dealNexstar Media Group Inc. officially reached a multiyear agreement with DirecTV. Here are the details behind the distribution deal. |
DirecTV, Nexstar reach deal to end two-month blackoutThe financial terms of the deal were not disclosed. The blackout began on July 2 after the companies clashed on Nexstar's demand that DirecTV more than double the fees paid for content from its network partners, including ABC, CBS and NBC. A similar spat between Walt Disney Co and Charter Communications that led to several channels including ESPN going dark on Charter's cable service was resolved earlier this month. |
UPDATE 2-DirecTV, Nexstar reach deal to end two-month blackoutAT&T-controlled distributor DirecTV said on Monday it had reached a multi-year deal with Nexstar Media Group that would return the local broadcaster's content to its network after a more than two-month blackout. The financial terms of the deal were not disclosed. began on July 2 after the companies clashed on Nexstar's demand that DirecTV more than double the fees paid for content from its network partners, including ABC, CBS and NBC. |
T Price Returns
1-mo | 8.12% |
3-mo | 0.86% |
6-mo | -15.08% |
1-year | 0.47% |
3-year | -12.97% |
5-year | -16.87% |
YTD | -12.92% |
2022 | 5.85% |
2021 | -8.09% |
2020 | -21.37% |
2019 | 45.55% |
2018 | -22.25% |
T Dividends
Ex-Dividend Date | Type | Payout Amount | Change | ||||||
---|---|---|---|---|---|---|---|---|---|
Loading, please wait... |
Continue Researching T
Want to do more research on At&T Inc's stock and its price? Try the links below:At&T Inc (T) Stock Price | Nasdaq
At&T Inc (T) Stock Quote, History and News - Yahoo Finance
At&T Inc (T) Stock Price and Basic Information | MarketWatch
Loading social stream, please wait...