
Uber Technologies, Inc. (UBER): Price and Financial Metrics
UBER Price/Volume Stats
| Current price | $64.40 | 52-week high | $82.14 |
| Prev. close | $65.74 | 52-week low | $40.09 |
| Day low | $64.18 | Volume | 17,377,085 |
| Day high | $66.26 | Avg. volume | 18,878,922 |
| 50-day MA | $68.43 | Dividend yield | N/A |
| 200-day MA | $65.52 | Market Cap | 134.57B |
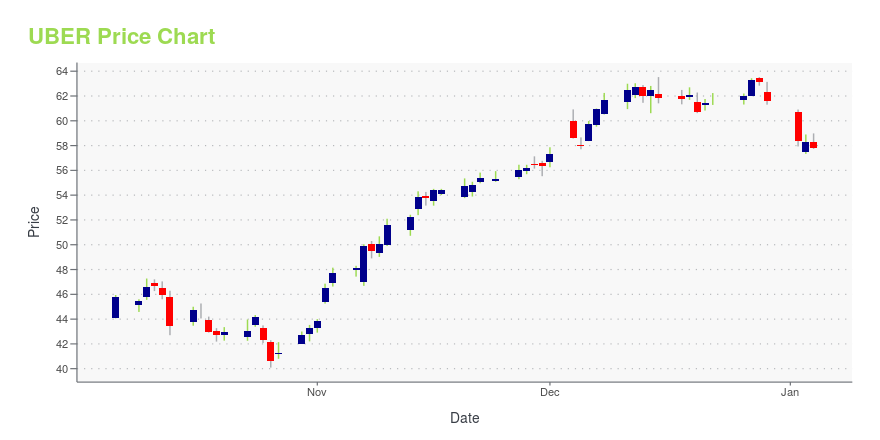
UBER Stock Price Chart Interactive Chart >
Uber Technologies, Inc. (UBER) Company Bio
Uber Technologies, Inc. develops and supports proprietary technology applications that enable independent providers of ridesharing, and meal preparation and delivery services to transact with riders and eaters worldwide. The company operates in two segments, Core Platform and Other Bets. Its driver partners provide ridesharing services through a range of vehicles, such as cars, auto rickshaws, motorbikes, minibuses, or taxis, as well as based on the number of riders under the UberBLACK, UberX, UberPOOL, Express POOL, and Uber Bus names; and restaurant and delivery partners provide meal preparation and delivery services under the Uber Eats name. The company also offers Uber Central, a tool that enables companies to request, manage, and pay for rides for their employees, customers, or partners; and Uber Health, which allows healthcare professionals to arrange rides for patients going to and from the care destinations. In addition, it provides freight transportation services to shippers in the freight industry under the Uber Freight name; leases vehicles to third-parties that use the vehicles to provide ridesharing or eats services through the platforms; and provides access to rides through personal mobility products, including dockless e-bikes and e-scooters under the JUMP name.
Latest UBER News From Around the Web
Below are the latest news stories about UBER TECHNOLOGIES INC that investors may wish to consider to help them evaluate UBER as an investment opportunity.
Nomura Just Hit LYFT Stock With a New DowngradeLYFT stock is in the red after receiving a downgrade from Nomura analysts Anindya Das and Masataka Kunugimoto. |
7 Cutting-Edge Tech Stocks That Will Define 2024After the massive gains artificial intelligence companies saw in 2023, there are additional gains to realize by investing in AI in 2024. |
To the Skies: 3 Flying Car Stocks to Buy for the Future of TransportationSoar into the future with these flying car stocks that are offering investors a chance at sky high profits. |
Uber Stock's Powerful Move Means The Bulls Are In Control. Why This Expert Sees Even More Strength Ahead.A strong run for bulls means a smooth ride for Uber stock as investors look ahead to 2024, says Jim Roppel. |
Nvidia, Tesla, and More: These 5 Stocks in the S&P 500 Are Having a Stellar 2023The stock market is set to end the year on a high note, but people holding certain stocks may be happier than the rest of us. |
UBER Price Returns
| 1-mo | -9.10% |
| 3-mo | -6.73% |
| 6-mo | -1.71% |
| 1-year | 38.17% |
| 3-year | 40.55% |
| 5-year | 44.65% |
| YTD | 4.60% |
| 2023 | 148.97% |
| 2022 | -41.02% |
| 2021 | -17.78% |
| 2020 | 71.49% |
| 2019 | N/A |
Loading social stream, please wait...