Veeva Systems Inc. (VEEV): Price and Financial Metrics


Veeva Systems Inc. (VEEV): $178.66

3.09 (+1.76%)

POWR Rating

Component Grades

Growth

S

Value

I

Momentum

G

Stability

N

Sentiment

U

Quality

P

VEEV POWR Grades

  • VEEV scores best on the Quality dimension, with a Quality rank ahead of 98.27% of US stocks.
  • The strongest trend for VEEV is in Quality, which has been heading down over the past 177 days.
  • VEEV's current lowest rank is in the Value metric (where it is better than 17.07% of US stocks).

VEEV Stock Summary

  • VEEV has a market capitalization of $27,335,779,631 -- more than approximately 92.15% of US stocks.
  • VEEV's current price/earnings ratio is 68.98, which is higher than 92.54% of US stocks with positive earnings.
  • VEEV's price/sales ratio is 13.16; that's higher than the P/S ratio of 92.46% of US stocks.
  • Stocks with similar financial metrics, market capitalization, and price volatility to VEEVA SYSTEMS INC are OLO, TTD, LTRX, LUMO, and OTIS.
  • Visit VEEV's SEC page to see the company's official filings. To visit the company's web site, go to www.veeva.com.

VEEV Valuation Summary

  • In comparison to the median Technology stock, VEEV's price/sales ratio is 432% higher, now standing at 13.3.
  • VEEV's EV/EBIT ratio has moved down 207.3 over the prior 115 months.

Below are key valuation metrics over time for VEEV.

Stock Date P/S P/B P/E EV/EBIT
VEEV 2023-03-21 13.3 8.1 69.6 54.3
VEEV 2023-03-20 13.0 7.9 68.2 53.2
VEEV 2023-03-17 12.9 7.9 67.8 52.9
VEEV 2023-03-16 13.2 8.0 69.1 53.9
VEEV 2023-03-15 12.8 7.8 67.1 52.3
VEEV 2023-03-14 13.0 7.9 68.0 53.0

VEEV Growth Metrics

    The 3 year net income to common stockholders growth rate now stands at 59.07%.
  • The 4 year price growth rate now stands at 217.28%.
  • Its 2 year net income to common stockholders growth rate is now at 31.09%.
Over the past 49 months, VEEV's revenue has gone up $1,262,364,000.

The table below shows VEEV's growth in key financial areas (numbers in millions of US dollars).

Date Revenue Operating Cash Flow Net Income to Common Stock
2022-09-30 2,077.17 771.127 396.269
2022-06-30 2,000.93 741.426 393.681
2022-03-31 1,922.306 767.105 411.938
2021-12-31 1,850.777 764.463 427.39
2021-09-30 1,762.039 778.76 433.212
2021-06-30 1,663.447 761.204 424.302

VEEV's Quality Factors

The “Quality” component of the POWR Ratings focuses on 31 different factors of a companies fundamentals and operational strength. Here are some key insights as we drill into the specifics of these quality attributes.
  • VEEV has a Quality Grade of A, ranking ahead of 97.34% of graded US stocks.
  • VEEV's asset turnover comes in at 0.545 -- ranking 298th of 561 Business Services stocks.
  • WLDN, BNFT, and VSEC are the stocks whose asset turnover ratios are most correlated with VEEV.

The table below shows VEEV's key quality metrics over time.

Period Asset Turnover Gross Margin ROIC
2021-07-31 0.545 0.726 0.455
2021-04-30 0.549 0.725 0.471
2021-01-31 0.555 0.721 0.453
2020-10-31 0.565 0.718 0.458
2020-07-31 0.564 0.720 0.508
2020-04-30 0.567 0.722 0.522

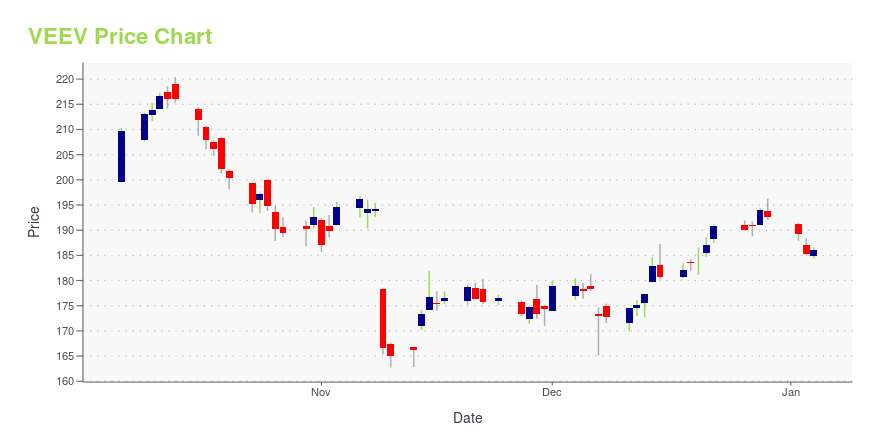
VEEV Stock Price Chart Interactive Chart >

Price chart for VEEV

VEEV Price/Volume Stats

Current price $178.66 52-week high $232.26
Prev. close $175.57 52-week low $151.02
Day low $177.23 Volume 603,700
Day high $181.56 Avg. volume 982,965
50-day MA $171.78 Dividend yield N/A
200-day MA $181.26 Market Cap 27.82B

Veeva Systems Inc. (VEEV) Company Bio


Veeva Systems provides cloud-based software solutions for the life sciences industry in North America, Europe, the Asia Pacific, and Latin America. The company was founded in 2007 and is based in Pleasanton, California.


VEEV Latest News Stream


Event/Time News Detail
Loading, please wait...

VEEV Latest Social Stream


Loading social stream, please wait...

View Full VEEV Social Stream

Latest VEEV News From Around the Web

Below are the latest news stories about VEEVA SYSTEMS INC that investors may wish to consider to help them evaluate VEEV as an investment opportunity.

More than 100 Biopharmas Increase Impactful Engagement with Veeva CRM Events Management

Veeva Systems (NYSE: VEEV) today announced more than 100 life sciences companies are using Veeva CRM Events Management to plan and execute in-person, virtual, and hybrid events worldwide. Supporting more than one million medical and commercial events to date, Events Management is helping teams lead more impactful healthcare professional (HCP) and key opinion leader (KOL) education and peer-to-peer interactions across channels.

Yahoo | March 28, 2023

Got $1,500? You Can Confidently Add These 3 Stocks to Your Portfolio

If you've learned little in your life about the stock market -- which is likely, as financial matters are not always taught in school -- you may be assuming that you need to be at least somewhat wealthy in order to invest in the stock market. Veeva Systems (NYSE: VEEV), with a recent market value topping $27 billion, specializes in cloud-based software that helps companies in various industries -- most notably the life sciences -- operate more efficiently. For example, it helps the pharmaceutical industry manage clinical trials and get them to market faster, when possible.

Yahoo | March 26, 2023

A Bull Market Is Coming: 1 Excellent Growth Stock to Buy Now

Let's consider one such stock: Veeva Systems (NYSE: VEEV). Life sciences companies routinely test brand-new and unproven clinical products or technologies on patients. Veeva Systems offers a range of cloud-based software services, ranging from data storage to clinical trial management, to help life sciences companies remain legally compliant while bringing their products to market faster and more efficiently.

Yahoo | March 25, 2023

Salesforce: Risks Looming on the Horizon

The company's dominant market position may come under threat in the coming years

Yahoo | March 23, 2023

Is Veeva Systems Inc.'s (NYSE:VEEV) Latest Stock Performance Being Led By Its Strong Fundamentals?

Most readers would already know that Veeva Systems' (NYSE:VEEV) stock increased by 4.9% over the past week. Given that...

Yahoo | March 18, 2023

Read More 'VEEV' Stories Here

VEEV Price Returns

1-mo 7.85%
3-mo 10.71%
6-mo 8.36%
1-year -16.52%
3-year 13.12%
5-year 144.67%
YTD 10.71%
2022 -36.83%
2021 -6.16%
2020 93.55%
2019 57.48%
2018 61.58%

Get Free Updates

Join thousands of investors who get the latest news, insights and top rated picks from StockNews.com!


Page generated in 0.7884 seconds.