StockNews.com
  • Login Join

StockNews.com
  • News
    • Top Stories
    • Video News
  • Best Stocks
    • "A" Rated Stocks
    • Upgrades/Downgrades
    • High Yield Dividend Stocks
    • Stock Screener
    • Top Stocks by Target Price
    • Dividend Discount Model Stock Valuation
    • Industry Rank
  • Best ETFs
    • "A" Rated ETFs
    • Best ETF Categories
    • High Yield ETFs
    • 7 Best ETFs
  • POWR Ratings
  • Upgrades/Downgrades
  • Watchlist
  • Screener
  • Services
    • Services Home
    • POWR Platinum
    • Reitmeister Total Return
    • Stocks Under $10
    • POWR Options
    • POWR Value
    • POWR Screens 10
    • POWR Income Insider
    • Premium
  • Login Join


  • Home
  • Posts tagged 'us dollar'
  • Uncategorized

Has the Value of the US Dollar Peaked?

Over the weekend, there were a lot of opinion pieces about the state of the US Dollar.  Some were very pointed in their belief that the US Dollar has peaked, while others were presaging its demise. This is because China can do things with credit that the US can’t.  A few laid out very specific reasons why last week’s high may very well be more than a local peak; remember the old trading saw, “technicals precede fundamentals.”

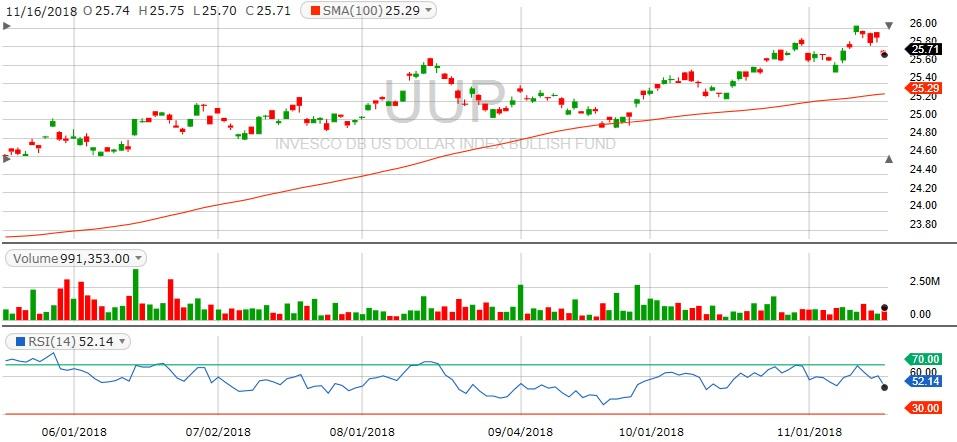
Is there any truth to all of this?  And if so, which way are the technical signs pointing – if technicals indeed precede fundamentals.  First, let’s look at the six-month chart:

UUP chart

Source: Fidelity.com

Well not much help there, that’s just a classic steady run-up chart. The very basic technicals — volume, RSI, 100-day SMA — aren’t saying too much other than we probably just hit a local top. RSI is falling fairly fast right now, which is typical behavior after either a short- or long-term top.

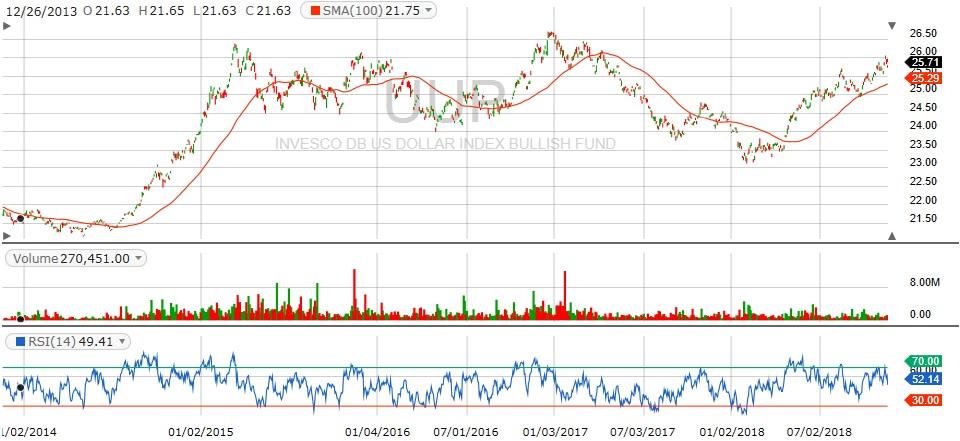
Let’s try a longer-term chart (on the Next Page):

UUP five year chart

Source: Fidelity.com


Well, your Gold Enthusiast looked at the one-year chart and it didn’t say much more. Also, the two-year chart isn’t quite telling enough of a story either.  So, unfortunately, we’re into a five-year chart.  In general, your Gold Enthusiast doesn’t like five-year charts for two basic reasons: One, the candles get so small they’re hard to see with aging eyes; and two, who the heck thinks conditions are similar enough over five years so, the chart actually says anything valid?
In response, we’ll have to concede that we are still in the longest bull run in US stock market history.  So conditions really have been similar until now over the past five years.  What we’re looking for is the end of this period, so it does make sense that we look at a five-year chart, because when things change the chart will show it.

Unfortunately, even this chart doesn’t spell out an impending doom or massive opportunity. The USD isn’t at an overall peak even for two years. In fact, it’s bouncing off the secondary peak below the highest peak.  So, the farthest out on a limb you can go with basic technicals is that it’s too early to tell if this is “the last” peak, or if this is just another wave in the trend.
Things we’ll be watching: The Euro, since it makes up over 50% of the US Dollar index — The EU and Italy are locked in battle right now (darn deficit spending!); any move by China toward a hard currency, i.e. backing yuan/RMB with gold; any sudden run-up in interest rates.  Those are probably the most significant canaries in this coal mine.

Signed, The Gold Enthusiast

DISCLAIMER: No specific security was mentioned in this article.  The author is long the gold mining sector through a small portfolio of ETFs and specific mining stocks.

  • 1
  • 2
Tagged with: us dollar

©2025 StockNews.com
About Us | Contact Us | Performance | Privacy Policy | Terms of Use | Supplemental Terms

Copyright © 2025. Market data provided is at least 10-minutes delayed and hosted by Barchart Solutions.
Information is provided 'as-is' and solely for informational purposes, not for trading purposes or advice, and is delayed. To see all exchange delays and terms of use, please see disclaimer.

This site is protected by reCAPTCHA and the Google Privacy Policy and Terms of Service apply.

Information contained on this website maintained by Magnifi Communities LLC is provided for educational purposes only and are neither an offer nor a recommendation to buy or sell any security, options on equities, or cryptocurrency. Magnifi Communities LLC and its affiliates may hold a position in any of the companies mentioned. Magnifi Communities LLC is neither a registered investment adviser nor a broker-dealer and does not provide customized or personalized recommendations. Any one-on-one coaching or similar products or services offered by or through Magnifi Communities LLC does not provide or constitute personal advice, does not take into consideration and is not based on the unique or specific needs, objectives or financial circumstances of any person, and is intended for education purposes only. Past performance is not necessarily indicative of future results. No trading strategy is risk free. Trading and investing involve substantial risk, and you may lose the entire amount of your principal investment or more. You should trade or invest only “risk capital” - money you can afford to lose. Trading and investing is not appropriate for everyone. We urge you to conduct your own research and due diligence and obtain professional advice from your personal financial adviser or investment broker before making any investment decision.

StockNews, a division of TIFIN Group LLC, is affiliated with Magnifi LLC (“Magnifi”) via common ownership. Affiliates of Magnifi will receive cash compensation for referrals of clients who open accounts with Magnifi. Due to this compensation, a conflict of interest exists since StockNews has an incentive to recommend Magnifi. Please see Magnifi’s Form ADV for additional information about fees and charges that may apply.