

We all agree that it would be wonderful if investors could time the market accurately, thus avoiding the biggest declines, while participating in strong bull market rallies.
However, as we also all know, good market timing is darn near impossible to pull off, at least for most people. I’ve spent 23 years studying the markets, historical data, behavioral finance, and investing theory.
In that time I’ve found that two powerful and time tested market timing strategies actually work, and can make investors filthy rich, but only if applied properly and consistently.
A Disciplined Combination of Asset Allocation and Momentum Trading
There’s a famous saying that most long-term investors swear by “time in the market is more important than timing the market”. That’s because timing the market well, for most people, is all but impossible, and literally the worst thing you can do with your portfolio.
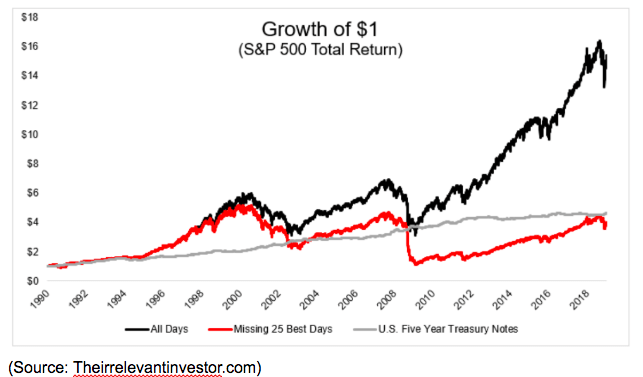
As Michael Batnick (aka “the Irrelevant Investor”) shows in this chart, missing just the best 25 single market gains since 1990 means that your portfolio would have not just underperformed the market, but even risk-free 5-year Treasury bonds.
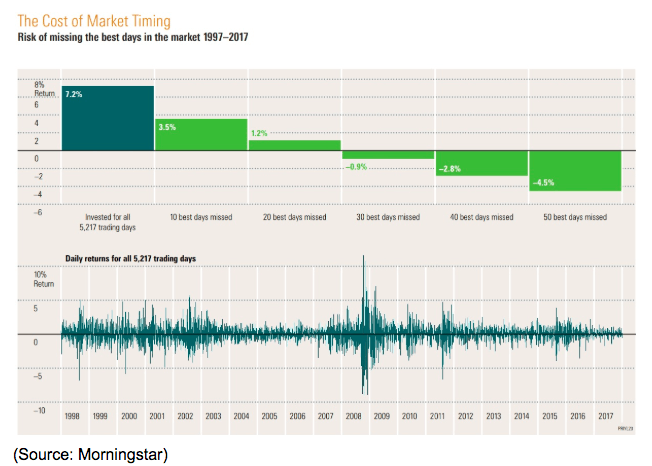
But wait it gets worse! Over the past 20 years missing just 30 of the best days means losing money, and missing just the best 50 days, less than 0.1% of market days, would have meant a 60% decline in your portfolio…over half an investing lifetime. Worst still, the market’s best days tend to be during times of peak volatility, which is why JPMorgan Asset management has found that most of the market’s best gains come within two weeks of the most devastating single day losses.
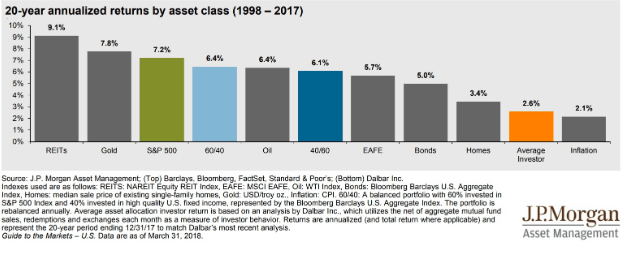
And since most people are absolutely terrible at market timing it’s no surprise that the average retail investor has not just underperformed the market over the past two decades, but all asset classes and barely beaten inflation.
Yet it’s also true that stock picking is very hard (less than 7% of mutual fund managers can even match the S&P 500 over 15 years according to S&P Global). Yet the “quest for alpha” continues because some legendary investors (like Buffett, Lynch, Graham, and Dodd) have proven that it can be done, not just over a few years, but for decades.
The same is true for market timing, which for most people is like alchemy (trying to turn lead into gold), impossible, but yet people keep trying, including very smart ones. I myself spent much of my early investing career hunting for some elusive combination of short-term trading strategies using technical analysis, not just for stocks, but also for commodities, options, and even currencies.
But there is a big difference between “nearly impossible” and “impossible”. Just like some investors can consistently crush the market through long-term investing good market timing is also possible IF you have the discipline to stick to a good strategy long enough.
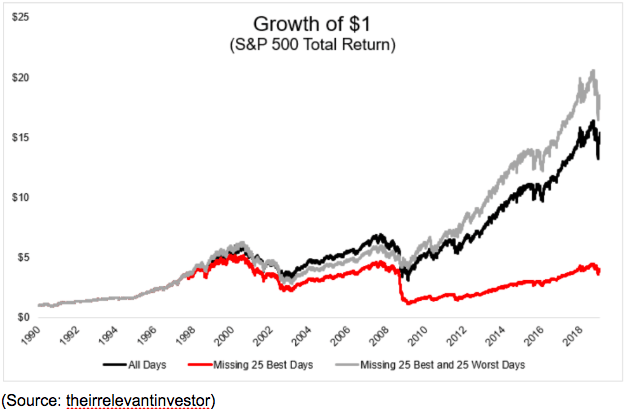
As you can see, you can still beat the market (though not by much) if you miss the 25 best and worst market days, because you avoid the big bear markets.
As Mr. Batnick explains in this article, you can achieve the above results by following 2 momentum strategies to shift your asset allocation.
- If the S&P 500 is above the 200-day moving average own a low-cost S&P 500 index fund.
- If it’s below it, sell that ETF and go all into bonds (also via low-cost ETFs)
Since 1997 this method has given 160 signals to shift from stocks to bonds or back again (sometimes as much as 30 in 1 month).
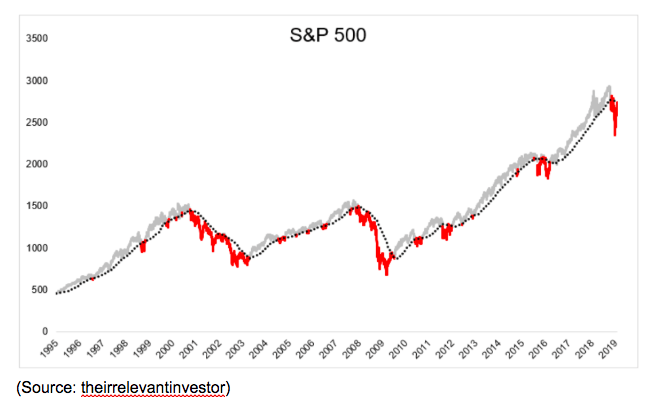
Since 1995 here is when this approach (which is among the most popular timing methods) would have looked. Red is when you’re in bonds, and gray is when you’re in stocks.
Now it needs to be pointed out that this backtest data ignores commissions, expense ratios, and capital gains taxes. Thus the small amount of alpha it generates over time might not be statistically significant. Or to put another way, in real life, this method of market timing might merely match the market or even underperform it slightly.
But it might still be worth using for some people because it offers far better risk-adjusted returns (total returns/volatility) by having much smaller peak drawdowns.
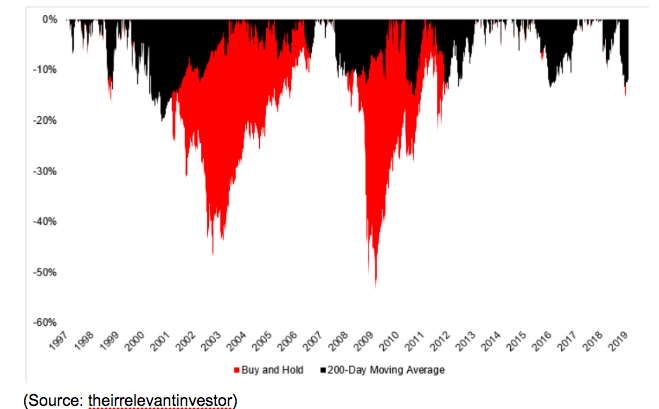
For example, in the past 20 years, the worst peak decline you would have suffered using this approach is -20% during the tech crash. During the Financial Crisis, your peak decline would have been about 15%, compared to -57% for buy and hold investors in the S&P 500.
More recently your declines would have been about equal to the market, which highlights the most important thing to know about any investing strategy. Over long periods of time, it won’t always work, and can even significantly underperform.
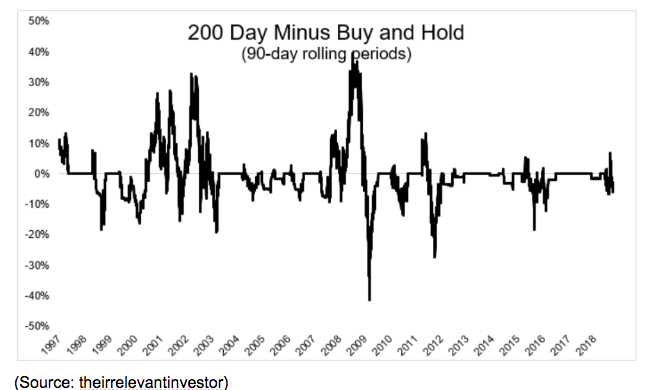
That’s especially true of this timing approach at the start of a bull market when stocks bottom and then surge strong, hard and fast. This approach will keep you in bonds and out of stocks for several months before the market reaches the 200-day moving average and signals the “all clear”.
As Batnick explains, when the market bottomed on March 9th, 2009 it then soared 41% before crossing the 200-day moving average on June 1st. You would have missed out on a heck of a rally using this approach.
That’s ultimately the problem with any market timing method, even one that has proven itself successful over time. You need an iron will and monk-like discipline to stick with any investing strategy because nothing will work all the time. That’s why fund managers (including billion dollar hedge fund gurus with an army of quants and supercomputers behind them) have such a tough time consistently beating the market.
Investors are impatient and if your strategy outperforms for a year or two? Well then they pull their money and so fund managers can’t wait out the natural period of underperformance that even the best strategies will go through.
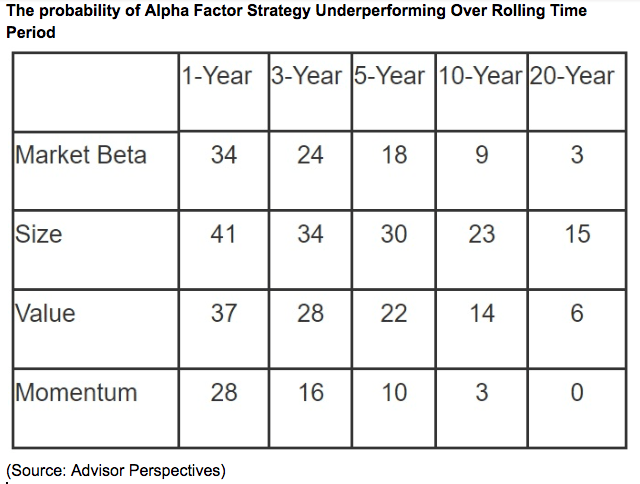
For instance, low volatility, small caps, value stocks, and momentum trading have all been proven to work. Yet that’s only because each strategy has underperformed for as long as 10 or even 20 years. Impatient investors have abandoned it to chase the latest “hot strategy” and thus allowed it to eventually work again.
But it’s precisely the fact that no strategy works all the time that any work at all! If some approach was truly a 100% sure thing way to outperform the market year in and year out, everyone would put all their money into it and it would stop working.
Which brings to mind two quotes. The first is from Batnick, the former broker who ran the backtest I’ve presented here.
“It’s important to keep in mind that backtests are easy, the real world is hard.”
The other is from Warren Buffett, the greatest investor in history
“We don’t have to be smarter than the rest, just more disciplined.”
So while this approach to market timing is one of the best you can use, it’s also one that’s rather academic for most people. Few have the discipline or patience to follow its simple rules to the letter for long enough to succeed.
Which is why I personally recommend, and use, what I consider to be a better market timing method.
A Disciplined Combination of Smart Asset Allocation and Contrarian Value Investing
The biggest difference between traders and investors is in their goals. Traders are looking to maximize profits from capital gains, while investors are looking to accumulate income producing assets over time. Corporate earnings are income, so this applies even to non-dividend stocks like Alaphabet (GOOG), Facebook (FB), and Amazon (AMZN).
This approach that I use for my own money is a contrarian one based on Buffett’s famous quote “be greedy when others are fearful and fearful when others are greedy.”
Basically, it’s a hybrid strategy that combines buy and hold investing and only applies market timing methodology to asset allocation, specifically what I’m doing with new money (and dividends). For a detailed explanation of the approach (and evidence of its power) see this article.
I only invest in quality stocks off my five watchlists, at times of peak market pessimism and fear (when valuations are lowest and forward total return potential is greatest). That means only buying during market pullbacks (5% to 9.9% declines from all-time-highs), corrections (10% to 19.9%) and bear markets (20+ declines).
No that doesn’t mean sitting out a bull market for years, because since WWII the market has averaged at least a pullback or better every six months. During times when the market is rising, I put all my savings and dividends into ultra-short-term treasuries, specifically the ETF BIL. This is a cash equivalent with high-liquidity, low expense ratio, and virtually no interest rate sensitivity (it would take a 10% increase in rates for it to decline by 1% in value). The ETF today yields 1.8% and basically matches inflation, which is better than what cash in your brokerage account does (like most banks, brokers pay nearly zero interest on cash).
During a pullback, flash crash or a “can’t-miss opportunity,” (like what occurred with Tobacco stocks recently) I buy on margin right away (opportunistically) then sell the necessary amount of BIL to pay that off.
If a recession is likely on its way (and thus a bear market) I’ll sell BIL and put all my money into VGLT (ultra-long-duration treasury bonds).
Why is that? Because the high-interest rate sensitivity of risk-free 10 and 30 year Treasuries means that when investors are fearful of a recession long-term rates fall and long bonds appreciate in value.
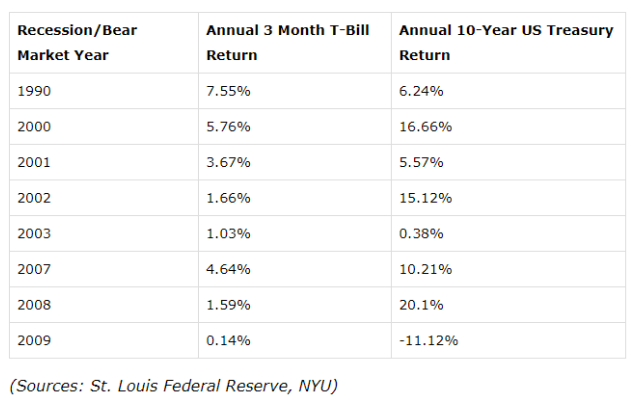
Mind you VGLT has a duration of 18 meaning that for each 1% decline in long-term rates (10-year yield) it would appreciate 18%. Thus the results using that ETF (currently yielding about 2.7%) would be even better than in the above table.
Essentially, my timing method is to just switch my asset allocation for new cash and incoming dividends to a counter-cyclical asset that will rise as stocks are falling.
That means I have more dry powder to buy ultra value dividend stocks at what’s likely to be near the market bottom. But how can one tell when the market is near its bottom? Just as no one rings a bell at the top, no one announces when stocks have bottomed.
It’s certainly true that perfectly calling the bottom isn’t possible but the historical analysis can help provide a rough guide to how low stocks usually fall.
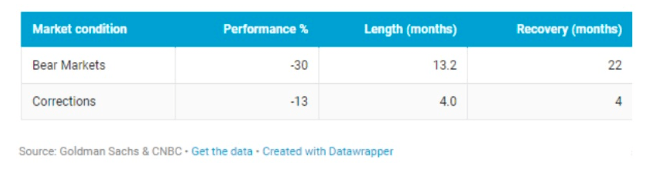
Since 1929 the average correction sees stocks fall for 4 months to a peak decline of 13%. The average bear market takes 13 months for stocks to fall 30% from the most recent all-time high.
That is a rough rule of thumb approach that I also use real-time economic and market data to help guide my investing decisions.
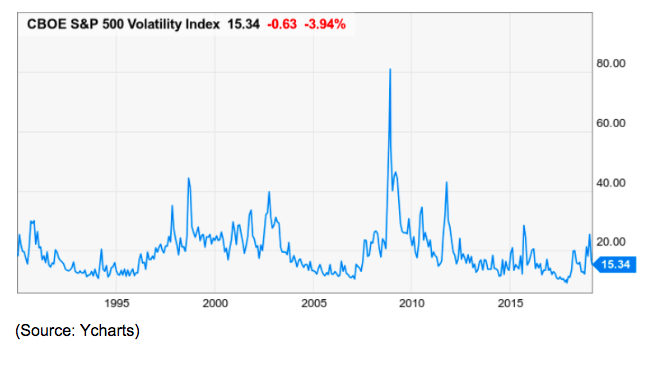
One of my favorite metrics for gauging market panic is the famous VIX volatility index (the so-called “fear index”). The key again is historical analysis. According to Ycharts since 2004 the average VIX has been 18.4 (closing day value). The median value from 2004 to 2014 was 17 and the most frequent value (the mode, rounded up to the most recent whole number) was 13.
In other words, if the VIX is below 13 that signals investor complacency (caused by low volatility rally) it’s above 18.4 that indicates fear. For my buying signals, I use 20.2 as my signal to start buying during a correction.
I’ll happily buy ultra value stocks (the most undervalued stocks on my watchlists) during a pullback which see deep value stocks reach even more ridiculous prices. The VIX doesn’t tend to spike too high during the regular pullback.
Rather I apply the VIX only to pullbacks that officially become corrections, and then hold off buying until I see that 20.2 reading (10% above historical average) to try to time aggressive buying for the correction bucket.
What’s a correction bucket? I mentally split my savings into 3 buckets, 50% for pullbacks (since they are more common), and then 50% of the remaining savings are for corrections, with the last half being for bear markets.
This approach ensures that I’m putting my money to work, usually at least once per year, but also have plenty of buying power available for the markets inevitable panics.
20.2 is a level that nearly every correction hits, thus avoiding missed opportunities. Mind you the VIX often soars far higher as it did in 2018’s 2 corrections. My goal isn’t to time the exact bottom, just avoid sitting out a great buying opportunity entirely.
During a bear market, I use the combination of historical averages (13-month decline to -30% from all-time high) as a starting point to get a rough idea of where the market is likely to drop to, but use a VIX of 30 as my buying signal.
In all the bear markets of the modern era (when VIX data is available), the VIX has always hit 40+ during a bear market. Why set the signal at 30 then and not wait until 40? Because the only two bear markets since 1995 were the tech crash (a bubble) and the Financial Crisis (also a historical abnormality).
Thus a VIX of 30 should coincide with an official bear market (stocks are down at least 20% from ATH) AND periods of immense fear, even during a regular bear market that doesn’t see the market plunge 50%.
So that’s when I start selling my bonds and buying stocks off the watchlist. What if I run out of bonds to sell? Then my high savings rate and weekly dividends ensure I’m buying something great every week for as long as the market is falling even lower.
Why not use this strategy fully, by going 100% into long bonds if a recession is coming (signaled by the 10y-3m yield curve inversion)?
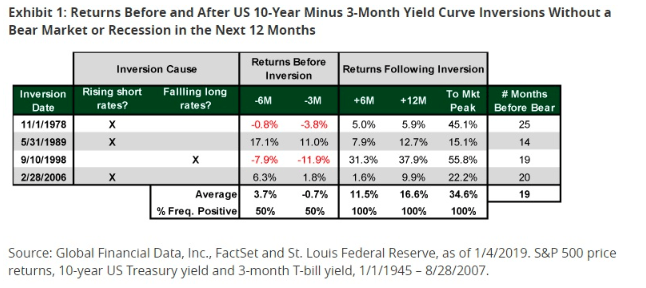
Well for one thing because any macro analysis is only a very rough probabilistic estimate of what’s likely to happen and when not a prediction of what will actually happen. Since 1978 stocks have on average risen for 19 months post-yield curve inversion, by an average of 35%.
Since my portfolio is designed to be 100% focused on low-risk dividend growth stocks that will avoid cutting payouts during recessions, there isn’t a need to sell quality assets that I bought in previous market declines (and pay hefty tax bills) and likely miss out on future gains.
And let’s not forget the nature of probability and macro analysis. It’s all based on the most recent trend but trends can change. For example, it’s possible the yield-curve, which has been falling steadily for 106 months, could stabilize and not invert at all, now that the Fed is done hiking rates. Thus market timers who are now out of the market for fear of a recession (jumping the ship in my opinion) might be horrified if the economy keeps growing for several more years and the bull market continues.
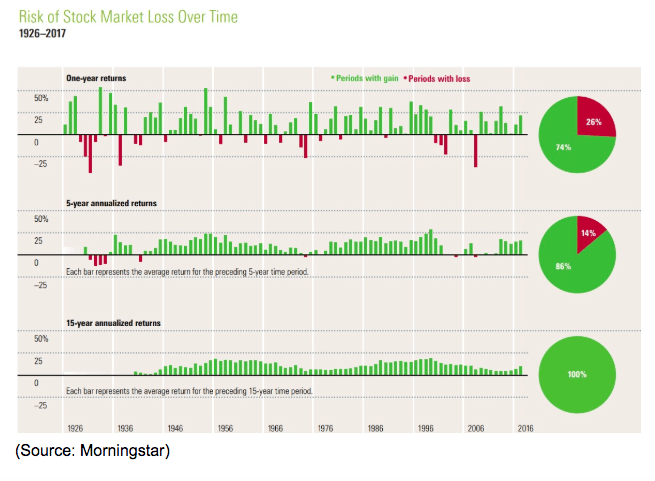
Never forget that good investing is about maximizing the probability of success. The stock market’s track record is quite clear. In 74% of years, the market goes up (since 1926) and over a five year period the probability of stocks rising is 86%.
In essence, my hybrid approach to only timing new money, while never selling previously bought shares (as long as the investments are intact) is designed to give me the best of both worlds. The power of long-term investing (exponential compounding) combined with contrarian value investing into dividend stocks whose safe and exponentially growing income will be enough to fund a comfortable retirement.
Bottom Line: Yes You Can Successfully Time the Market. BUT it Takes the Patience and Discipline of a Monk as Well as the Right Strategy
Market timing with perfect accuracy is not possible, because if a system for pinpoint entry and exits from stocks existed, whoever came across it would own half the world by now.
But good market timing does exist, and it isn’t just the plaything of short-term traders. Good market timing requires a disciplined, and patient approach, devoid of emotions, and incorporating smart asset allocation that also involves bonds (or some other asset class that is counter-cyclical to stocks).
The 200-day market moving average is one popular timing approach that actually works, BUT only if you combine it with the use of bonds, AND stick with the strategy through painful periods of mixed and frequent signals and long periods of underperformance.
The other time tested way of timing the market is to only time when you buy, not when you sell (since the goal is to own quality income producing assets bought at great prices for as long as possible). This is my preferred method, that I use for my own savings and retirement portfolio.
That means using a combination of either short-term T-bills or long-term Treasuries, to store up dry powder and then wait for the market’s inevitable (and historically frequent) declines (pullbacks/corrections/bear markets).
Then you can use the VIX as a rough proxy for market fear to get an estimate for when the market decline is likely near its bottom during corrections. When your entry signal triggers, you cash out your bonds and pile into the best quality and deeply undervalued stocks that meet your personal investing profile and goals.
Ultimately both approaches work, with the first being the simpler one, because you can use ETFs and a passive approach. The second method is better for longer-term focused investors, including dividend investors, and requires more active management and the careful curation of quality watchlists, without which you won’t know what to buy when market panic is at its peak.
My Deep Value Dividend Growth Portfolio (beating the market by 9.7% so far) is built around five watchlists of low-risk dividend growth stocks that I trust to generate generous, safe and fast-growing income, as well as likely long-term total returns of 15% to 17%.
About the Author: Adam Galas

Adam has spent years as a writer for The Motley Fool, Simply Safe Dividends, Seeking Alpha, and Dividend Sensei. His goal is to help people learn how to harness the power of dividend growth investing. Learn more about Adam’s background, along with links to his most recent articles. More...
9 "Must Own" Growth Stocks For 2019
Get Free Updates
Join thousands of investors who get the latest news, insights and top rated picks from StockNews.com!
Top Stories on StockNews.com

Best & Worst Performing Mega Cap Stocks for July 11, 2025
AEXAY leads the way today as the best performing mega cap stock, closing up 34.37%.
Best & Worst Performing Mega Cap Stocks for July 10, 2025
AEXAY leads the way today as the best performing mega cap stock, closing up 13.49%.
Best & Worst Performing Mega Cap Stocks for July 9, 2025
AEXAY leads the way today as the best performing mega cap stock, closing up 13.49%.
Best & Worst Performing Mega Cap Stocks for July 8, 2025
AEXAY leads the way today as the best performing mega cap stock, closing up 13.49%.