Amazon.com, Inc. (AMZN): Price and Financial Metrics

Amazon.com, Inc. (AMZN): $174.48

0.06 (+0.03%)

POWR Rating

Component Grades

Momentum

B

Stability

C

Sentiment

Quality

B

Add AMZN to Watchlist
Sign Up

Industry: Internet

Industry

B

Ranked

#4 of 52

in industry

AMZN Price/Volume Stats

Current price $174.48 52-week high $180.14
Prev. close $174.42 52-week low $95.70
Day low $174.28 Volume 31,250,600
Day high $176.69 Avg. volume 46,278,883
50-day MA $166.20 Dividend yield N/A
200-day MA $143.40 Market Cap 1.81T

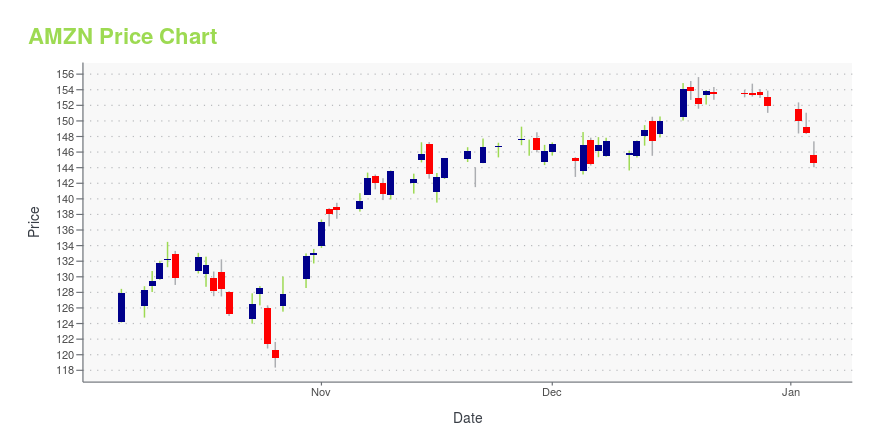
AMZN Stock Price Chart Interactive Chart >

AMZN POWR Grades

  • AMZN scores best on the Sentiment dimension, with a Sentiment rank ahead of 99.61% of US stocks.
  • The strongest trend for AMZN is in Quality, which has been heading up over the past 26 weeks.
  • AMZN's current lowest rank is in the Value metric (where it is better than 8.73% of US stocks).

AMZN Stock Summary

  • AMZN has a market capitalization of $1,534,293,521,103 -- more than approximately 99.93% of US stocks.
  • With a price/earnings ratio of 76.41, AMAZON COM INC P/E ratio is greater than that of about 91.81% of stocks in our set with positive earnings.
  • In terms of twelve month growth in earnings before interest and taxes, AMAZON COM INC is reporting a growth rate of 115.48%; that's higher than 90.74% of US stocks.
  • If you're looking for stocks that are quantitatively similar to AMAZON COM INC, a group of peers worth examining would be GOOGL, NVDA, META, TSLA, and LLY.
  • AMZN's SEC filings can be seen here. And to visit AMAZON COM INC's official web site, go to www.amazon.com.

AMZN Valuation Summary

  • AMZN's EV/EBIT ratio is 63.6; this is 315.69% higher than that of the median Consumer Cyclical stock.
  • AMZN's price/earnings ratio has moved up 684.7 over the prior 243 months.

Below are key valuation metrics over time for AMZN.

Stock Date P/S P/B P/E EV/EBIT
AMZN 2023-12-29 2.8 8.6 78.2 63.6
AMZN 2023-12-28 2.9 8.7 78.9 64.1
AMZN 2023-12-27 2.9 8.7 78.9 64.1
AMZN 2023-12-26 2.9 8.7 79.0 64.2
AMZN 2023-12-22 2.9 8.7 79.0 64.2
AMZN 2023-12-21 2.9 8.7 79.2 64.3

AMZN Growth Metrics

    The 2 year net income to common stockholders growth rate now stands at 102.74%.
  • The year over year price growth rate now stands at -28.32%.
  • The 4 year net cashflow from operations growth rate now stands at 133.54%.
Over the past 34 months, AMZN's revenue has gone up $217,710,000,000.

The table below shows AMZN's growth in key financial areas (numbers in millions of US dollars).

Date Revenue Operating Cash Flow Net Income to Common Stock
2022-12-31 513,983 46,752 -2,722
2022-09-30 502,191 39,665 11,323
2022-06-30 485,902 35,574 11,607
2022-03-31 477,748 39,324 21,413
2021-12-31 469,822 46,327 33,364
2021-09-30 457,965 54,672 26,263

AMZN's Quality Factors

The “Quality” component of the POWR Ratings focuses on 31 different factors of a companies fundamentals and operational strength. Here are some key insights as we drill into the specifics of these quality attributes.
  • AMZN has a Quality Grade of B, ranking ahead of 82.65% of graded US stocks.
  • AMZN's asset turnover comes in at 1.321 -- ranking 98th of 165 Retail stocks.
  • ELA, BIG, and KR are the stocks whose asset turnover ratios are most correlated with AMZN.

The table below shows AMZN's key quality metrics over time.

Period Asset Turnover Gross Margin ROIC
2021-09-30 1.321 0.413 0.121
2021-06-30 1.378 0.407 0.145
2021-03-31 1.415 0.400 0.151
2020-12-31 1.426 0.396 0.131
2020-09-30 1.410 0.402 0.123
2020-06-30 1.424 0.403 0.110

AMZN Price Target

For more insight on analysts targets of AMZN, see our AMZN price target page. And for a list of of all stocks sorted by upside potential based on analyst target price, see our Top Price Target page.

Average Price Target $4,157.35 Average Broker Recommendation 1.34 (Strong Buy)

Amazon.com, Inc. (AMZN) Company Bio


Originally called “Cadabra,” Amazon.com, Inc’s website was launched on July 16th, 1995 by CEO and founder Jeff Bezos, selling only books online.  Amazon provides a full suite of online retail shopping services. Moreover, the company has expanded beyond retail e-commerce to focus on four discrete customer sets: consumers, sellers, enterprises, and content creators. The company also provides other marketing and promotional services, such as online advertising and co-branded credit card agreements.  In addition, Amazon manufactures and sells products such as, Kindle E-reader, Fire tablets, Fire TV, Amazon Echo, and Alexa. The company operates through three segments: North America, International, and Amazon Web Services (AWS). The North America segment consists of retail sales of consumer products and subscriptions through North America-focused websites such as www.amazon.com and www.amazon.ca. The International segment consists of retail sales of consumer products and subscriptions through internationally focused locations. AWS is the largest cloud computing platform, and the primary profit driver for Amazon. In 2020, AWS broke the record of being a $10 billion business. Amazon controls more than a third of the cloud market, almost twice its next closest competitor.


AMZN Latest News Stream


Event/Time News Detail
Loading, please wait...

AMZN Latest Social Stream


Loading social stream, please wait...

View Full AMZN Social Stream

Latest AMZN News From Around the Web

Below are the latest news stories about AMAZON COM INC that investors may wish to consider to help them evaluate AMZN as an investment opportunity.

E-Commerce Evolution: 3 Retail Stocks Transforming Shopping in 2024

After making heavy investments in their e-commerce operations, these retail stocks expect increased sales in 2024.

Charles Munyi on InvestorPlace | January 2, 2024

Trading The Super Seven: Recap

In this article, we will review the performance of each of the Super Seven companies that may help you understand why they are “the talk of the town.”

TalkMarkets.com | January 1, 2024

2024’s Power Players: 7 Stocks Racing to a Trillion Valuation

Whether in 2024, or in the years ahead, each of these seven stocks could become the next trillion dollar companies.

Thomas Niel on InvestorPlace | January 1, 2024

Legacy Investments: 7 Stocks to Make Your Grandkids Millionaires

If you believe in long-term investing like me, you will look for stocks that have a strong performance history and an ability to thrive in uncertain situations.

Vandita Jadeja on InvestorPlace | December 31, 2023

AI and Automation Leaders for 2024: 7 Stocks to Stay Ahead of the Robot Uprising

It’s time for investors to ditch the search for the mythical crystal ball and instead embrace the algorithms when deciphering the best AI stock for your needs.

Josh Enomoto on InvestorPlace | December 30, 2023

Read More 'AMZN' Stories Here

AMZN Price Returns

1-mo 2.93%
3-mo 14.70%
6-mo 34.91%
1-year 78.57%
3-year 13.48%
5-year 91.81%
YTD 14.83%
2023 80.88%
2022 -49.62%
2021 2.38%
2020 76.26%
2019 23.03%

Get Free Updates

Join thousands of investors who get the latest news, insights and top rated picks from StockNews.com!