

As investors try to suss out whether we are entering a longer-term bull market, one of the tea leave indicators they’re turning to is the Dow Theory.
Dow Theory revolve around the Dow Jones Industrial Average (DJIA) and Dow Jones Transportation Average either confirming or not confirming each other’s trends.
That is if one of its averages (industrial or transportation) advances above a previous important high and is accompanied or followed by a similar advance in the other average. For example, if the Dow Jones Industrial Average (DJIA) climbs to an intermediate high, the Dow Jones Transportation Average (DJTA) is expected to follow suit within a reasonable period of time.
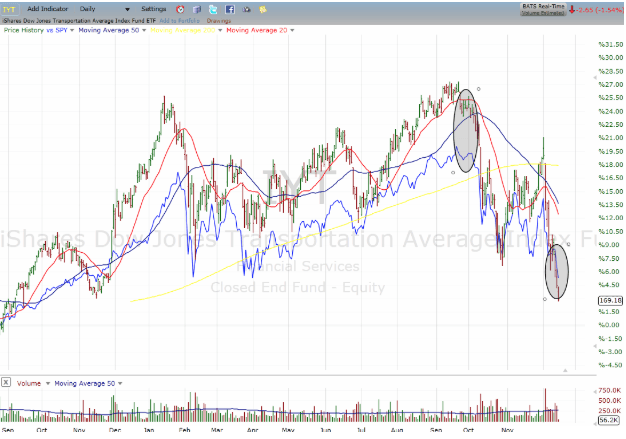
As you can see, the transports started rolling over in early September before the broader market peaked. It also has now been making new lows over the past week, again earlier than broader indices.
The Idea Behind Dow Theory
The idea behind Dow Theory is that the transportation index, which has grown from simply railroads o include trucking, shipping, and air cargo, I that these companies that deliver goods great gauge of not only the overall health of the economy but also a good leading indicator. If it diverges from the industrials, it’s considered a warning flag about the ongoing trend.
There are also other aspects of Dow Theory that we need to pay attention to even more.
First and foremost is that it should not be taken as buy or sell signal; just a tool for identifying a trend or more importantly a change in trend.
With that said, it should be noted that trends can have multiple time frames and for a bull market to end a full-blown bear to begin can take years to develop.
Also, there are various kinds and stages of a trend. For example, within a bull market, there can be a pullback. As we’ve seen, within downtrends or bear markets, you can have face-ripping rallies. But even within these secondary or countertrend moves, you can have the daily noise of back and forth within a range.
While a divergence of one index (i.e. the transports) to another can signal a possible trend change, a confirmation of a change in the primary trend of the various indices must all set new highs or lows.
The reason we focus on indexes is that they provide a true overall snapshot of the market; that is aggregate averages discount all known information. Whether fundamental, economic data, earnings estimates, and results in investors’ sentiment, are all priced into the market.
With today’s move down the Industrials, we seem to confirm that the new lows of the Transports suggests that there is more of a downside ahead. Just be aware of the countertrend rallies.
About the Author: Steve Smith

Steve has more than 30 years of investment experience with an expertise in options trading. He’s written for TheStreet.com, Minyanville and currently for Option Sensei. Learn more about Steve’s background, along with links to his most recent articles. More...
9 "Must Own" Growth Stocks For 2019
Get Free Updates
Join thousands of investors who get the latest news, insights and top rated picks from StockNews.com!
Top Stories on StockNews.com

Best & Worst Performing Stock Industries for July 26, 2024
Led by ticker KGJI, "Fashion & Luxury" was our best performing stock industry of the day, with a 1,299.75% gain.
Best & Worst Performing Mid Cap Stocks for July 26, 2024
GSHD leads the way today as the best performing mid cap stock, closing up 29.21%.
Best & Worst Performing Small Cap Stocks for July 26, 2024
KGJI leads the way today as the best performing small cap stock, closing up 100,000.00%.
Best & Worst Performing Large Cap Stocks for July 26, 2024
NOW leads the way today as the best performing large cap stock, closing up 13.40%.