
Leading Information Technology (IT) conglomerate International Business Machines Corporation (IBM) has been bestowed with an ‘Outperform’ rating by RBC Capital Markets. This endorsement stems from IBM’s potential growth and promising prospects, specifically within the thriving Artificial Intelligence (AI) market.
Despite this optimistic outlook, IBM reported a marginal 0.4% year-over-year decline in its second-quarter revenue, which totaled $15.50 billion. The firm’s infrastructure revenue also witnessed a substantial 15% dip compared to the same period the previous year.
In light of these figures, it is recommended that potential investors delve into IBM’s key financial trends. A comprehensive understanding of these factors can assist in determining an optimal investment entry point, potentially maximizing returns when the financial climate seems healthier.
IBM’s Financial Performance: Analyzing Fluctuations in Key Metrics from 2020 to 2023
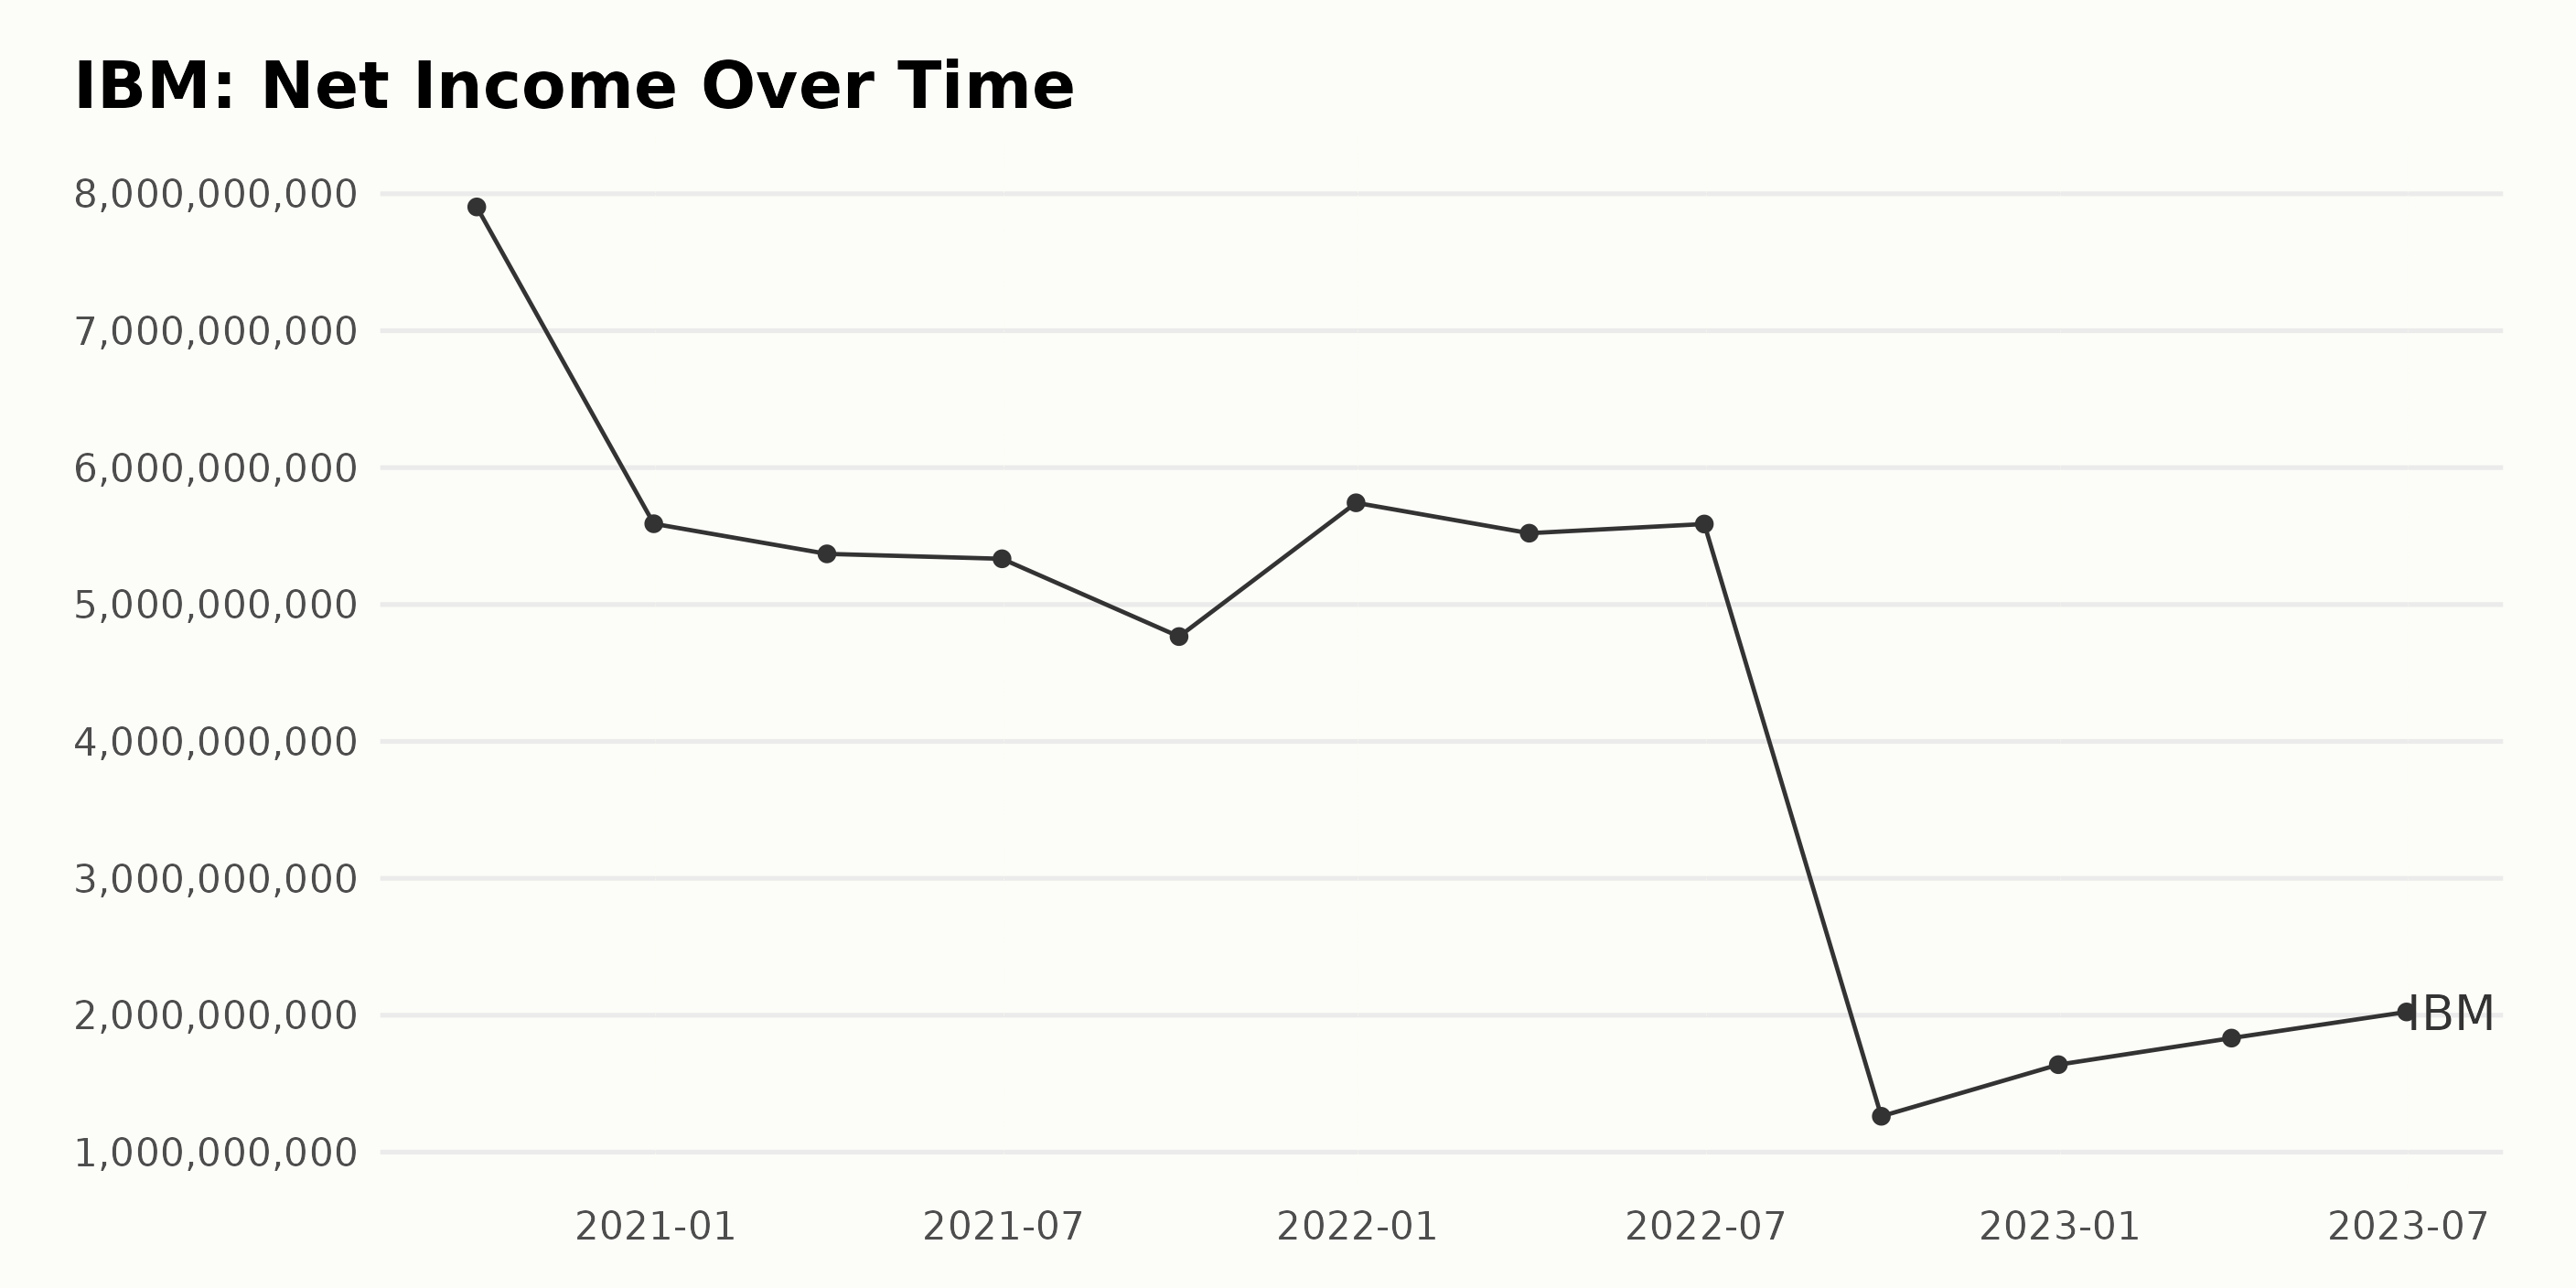
The trailing-12-month net income of IBM has displayed a fluctuating trend over the period from September 30, 2020, to June 30, 2023.
- Between September 2020 and December 2020, the net income declined from $7.90 billion to $5.59 billion.
- The net income continued to decline marginally throughout 2021, reaching $4.77 billion in September 2021, but ended the year slightly up at $5.74 billion in December.
- In the first half of 2022, the net income was relatively stable, with $5.52 billion in March and $5.59 billion in June. However, there was a significant drop to $1.26 billion by September 2022. Despite bouncing back to $1.64 billion in December 2022, IBM’s net income didn’t reach its earlier levels.
- In the first half of 2023, there has been a steady growth from $1.83 billion in March to $2.02 billion in June.
In terms of a growth rate, comparing IBM’s net income from September 30, 2020, of $7.9 billion, to June 30, 2023, of $2.02 billion, signifies a substantial decrease. This suggests that there have been more challenging economic circumstances for IBM in recent years. More attention should be given to the significantly reduced figures in late 2022 and the steady recovery in early 2023.
Here’s an analysis of the data trends and fluctuations of IBM’s trailing-12-month revenue:
- On September 30, 2020, IBM posted a revenue of $75.03 billion.
- A slight decrease occurred by the end of that year, with revenue standing at $73.62 billion on December 31, 2020.
- The beginning of 2021 saw relatively stable revenue figures, hovering around $73.78 billion in March, $74.40 billion in June, and slightly increasing to $74.46 billion in September 2021.
- However, a significant drop happened by the end of 2021, with the revenue falling sharply to $57.35 billion on December 31, 2021.
- This downward trend continued into 2022 as the revenue decreased successively from $53.82 billion in March to $50.61 billion in June and fell further to $47.10 billion in September 2022.
- An outlier was observed in December 2022, when the revenue shot up significantly to $60.53 billion.
- The revenue appears to stabilize in 2023, with roughly constant figures from $60.58 billion in March to $60.52 billion in June 2023.
Comparing the first recorded revenue of $75.03 billion on September 30, 2020, to the last recorded figure of $60.52 billion on June 30, 2023, it indicates a decrease, suggesting negative growth over the analyzed period.

The series of data presented represents the gross margin of IBM from the end of the third quarter of 2020 to the end of the second quarter of 2023.
- September 2020: IBM’s gross margin was 48.20%.
- December 2020: It saw a slight increase to 48.30%.
- The margin stayed relatively stable during the first half of 2021, at 48.60%, as noted in both March and June.
- There was a small decrease to 48.20% by September 2021.
- However, by December 2021, the gross margin notably increased to 54.90%.
- It continued to rise during the first three quarters of 2022, with consistent increases to 56.90% in March, 59.10% in June, and it peaked at 61.90% in September.
- A significant drop was observed by the end of 2022 to 54.00%
During the first half of 2023, the data shows a consistent but slow growth:
- March 2023: The gross margin was 54.20%.
- June 2023: It slightly grew to 54.60%.
In conclusion, from September 2020 to June 2023, the gross margin of IBM fluctuated between 48.20% and 61.90%, with a tendency toward growth during this period. The last recorded gross margin as of June 2023 was 54.60%. The overall growth rate for this period, measuring from September 2020 (48.20%) to June 2023 (54.60%), is approximately 13.28%.

IBM has seen undulations in its asset turnover, a trend that’s notable throughout the series of data. Here’s a summary of the fluctuations:
- In September 2020, the asset turnover was at 0.49.
- It experienced a slight drop by the end of the year in December 2020 to 0.48.
- In the first quarter of 2021, there was an insignificant increase to 0.48, before reaching a peak of 0.50 by September 2021.
- However, the value dropped significantly by the end of the year 2021 to 0.40 and continued on this diminishing trajectory: Decreasing to 0.39 in March 2022, falling further to 0.38 by June 2022, and reaching a low of by September 2022 of 0.36.
- Interestingly, there was a recovery to a value of 0.47 by December 2022, maintaining that figure through March 2023 before experiencing a slight dip to 0.47 by June 2023.
To calculate the growth rate, we measure the difference between the last value of 0.47 (June 2023) and the first value of 0.49 (September 2020). The overall change displays a decrease in the asset turnover over the series.

Analyzing IBM’s Stock Price Fluctuations and Ascending Trend in H1 2023
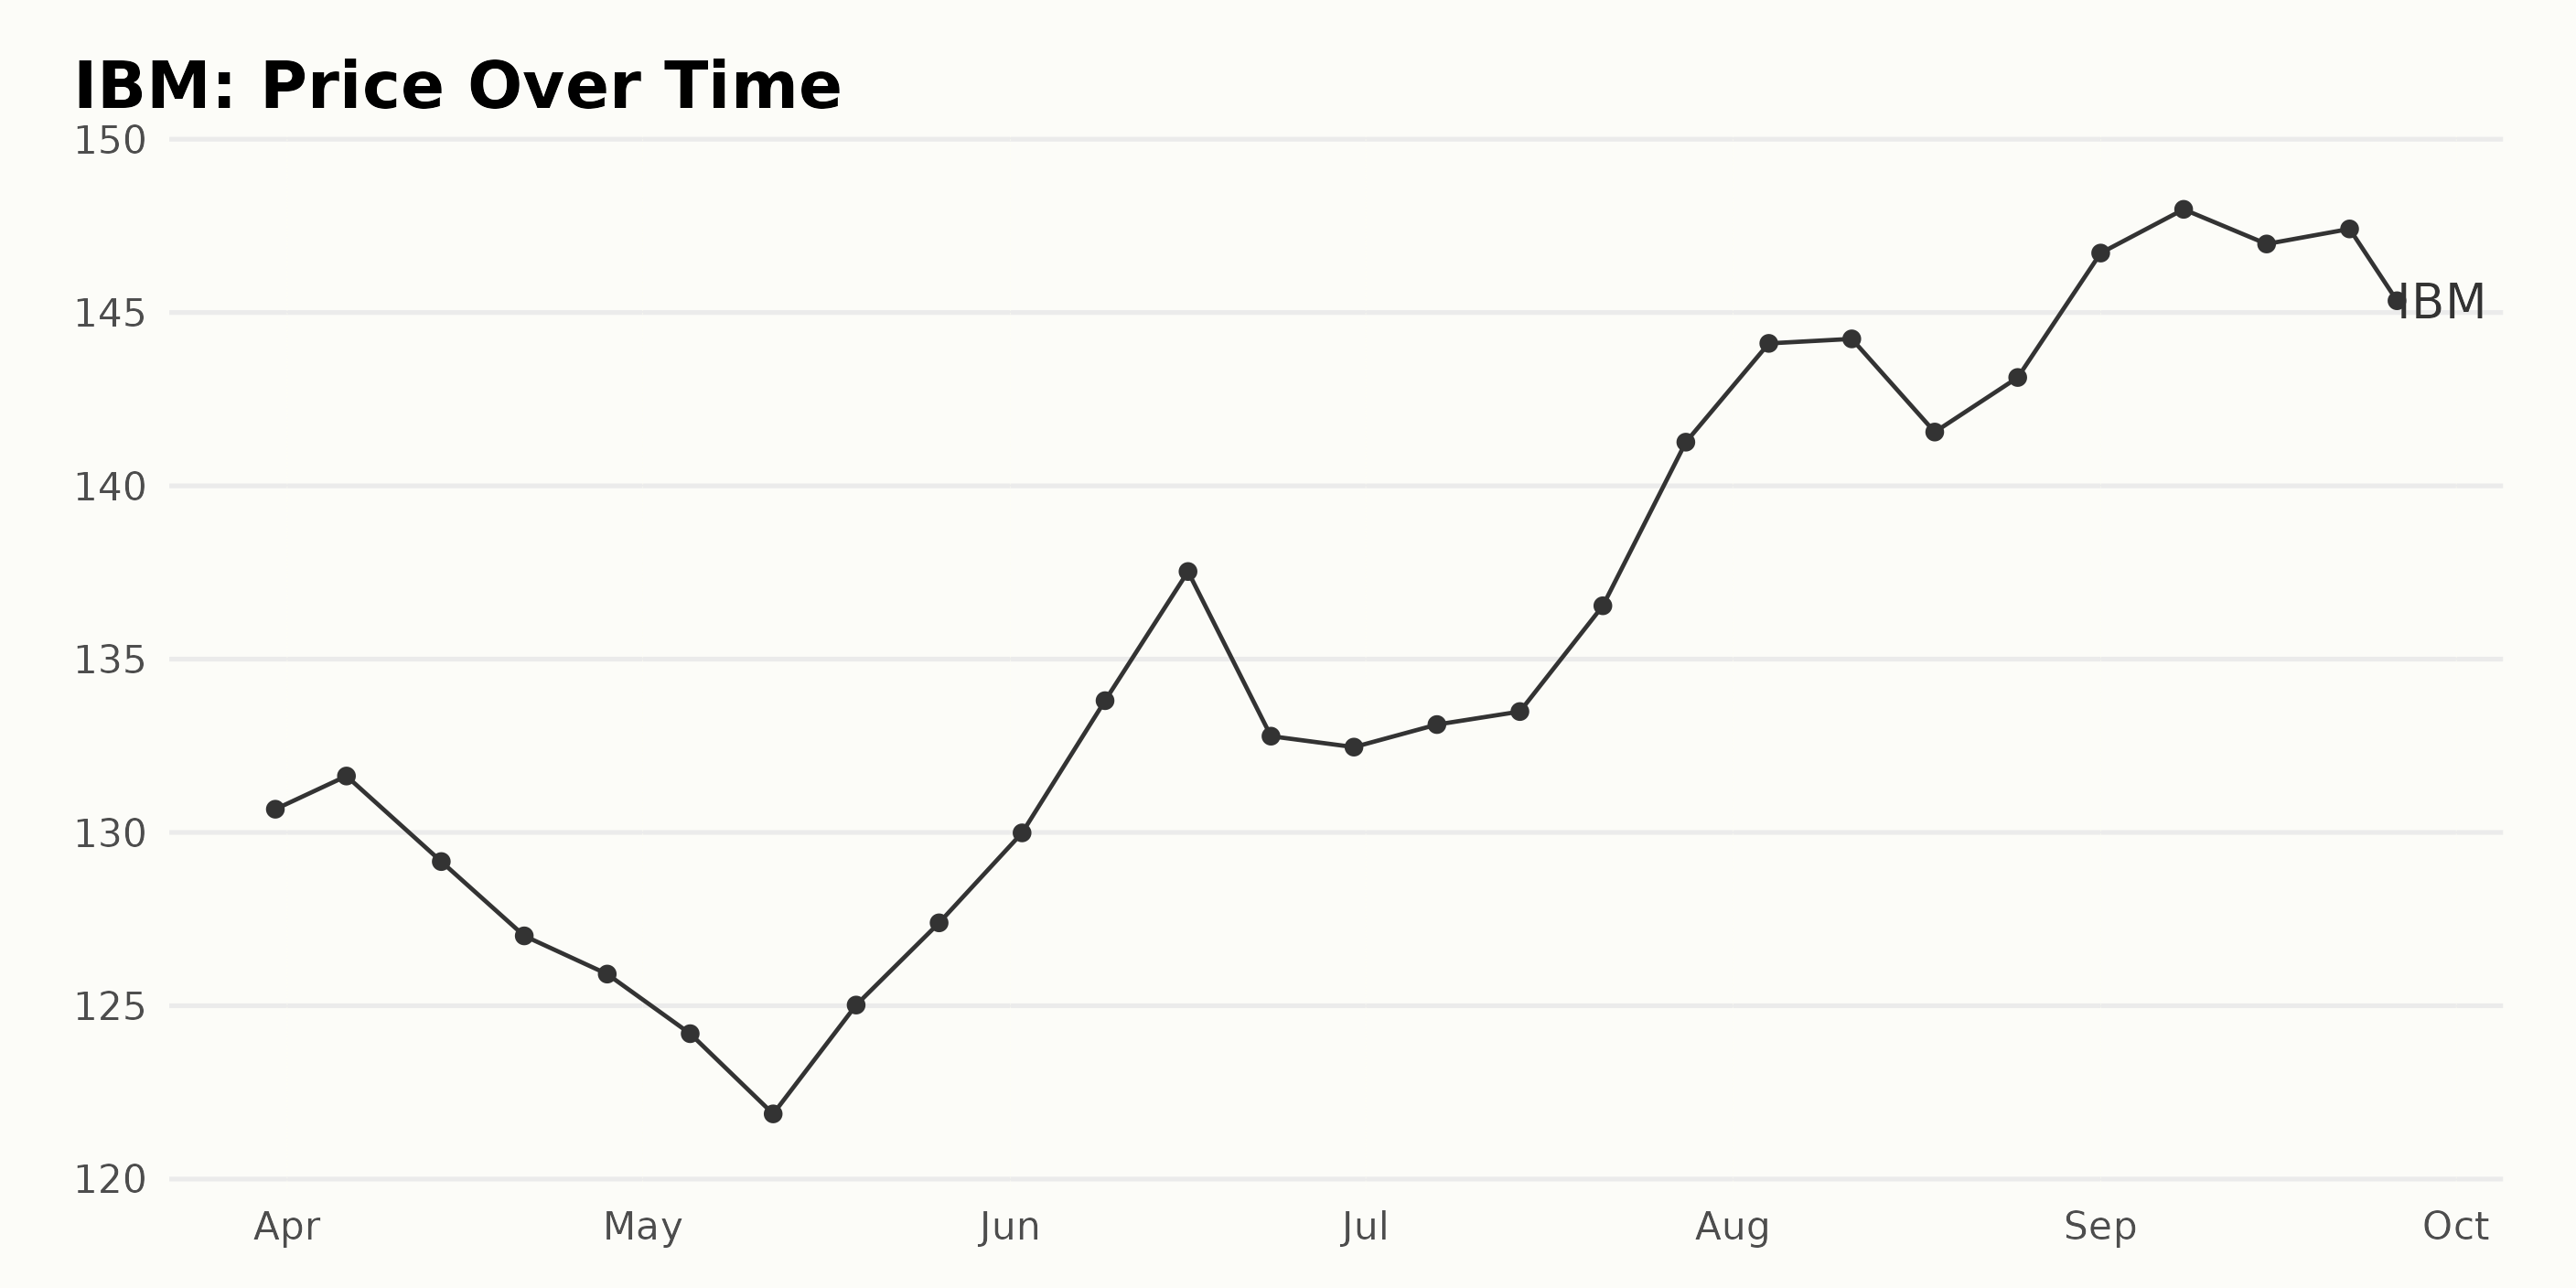
The share price of IBM shows a fluctuating trend with periods of both increase and decrease between March 31, 2023, and September 26, 2023. Below is the detailed trend observed during that period:
- On March 31, 2023, IBM’s price was $130.67.
- The price marginally increased to $131.63 on April 6, 2023, but it followed a decreasing trend through May 12, 2023, hitting a low of $121.88.
- A recovery is evident from May 19, 2023 ($125.02) as the price edged higher, reaching a peak of $137.53 on June 16, 2023.
- The price then declined again to reach $132.46 by June 30, 2023, before increasing gradually to $141.26 on July 28, 2023.
- In August 2023, IBM hit its highest price for this period at $144.24 (August 11), but it reduced slightly to $141.55 by August 18.
- However, the price soared back up to $147.98 (the highest in this period) by September 8, 2023, but decreased to $143.24 by September 26, 2023.
Overall, while there were fluctuations, generally, an upward price trend is observed with an acceleration of growth rate towards the end of this period. This is evidenced by the fact that the lowest price was seen in May and the highest in September, and despite periodic drops, the overall movement was upward. Here is a chart of IBM’s price over the past 180 days.
IBM’s Performance: Noteworthy Ratings in Quality, Growth, and Stability
The POWR Ratings grade for the Technology – Services company IBM has shown fluctuations over time, according to the data. Here’s a summary:
- Starting with a grade of B (Buy) and a rank of #26 within the category in April 2023, IBM improved to #22 place by mid-April.
- However, the grade dropped to C (Neutral) by April 22, 2023, with the rank worsening to #27.
- This downward trend continued, reaching a low point in early May with a position of #30 out of 76 companies in IBM’s category.
- In late May and June, the company maintained a steady POWR grade of C (Neutral) with varying ranks in the category between #29 and #30.
- In July, despite retaining a C (Neutral) grade, IBM’s rank improved slightly to #27.
- The company’s performance improved notably in late July, with the POWR grade returning to B (Buy) and the rank improving to #20, continuing to improve to #16 by the end of the month.
- Throughout August, IBM retained a B (Buy) grade, although the rank in category varied between #19 and #24.
- In September, the POWR grade oscillated between B (Buy) and C (Neutral), with a ranking fluctuating similarly between #22 and #32, marking a slide in performance toward the end of this period.
As of the most recent data on September 27, 2023, IBM has a POWR Grade of C (Neutral), and its rank within the Technology – Services category is #33 out of 76 stocks.
In analyzing IBM across its most noteworthy POWR Ratings dimensions, Quality, Growth, and Stability show the respective highest ratings.
Quality
- The Quality dimension consistently recorded the highest average rating for IBM throughout the observed periods. In March 2023, IBM scored a Quality rating of 93. While it later dipped to 86 in May 2023, the figure returned upward to reach 90 by August 2023.
Growth
- IBM also exhibited strong Growth scores over the measured period. There was a slight fluctuation between 85 and 86 from March to July 2023. However, it dropped notably to 80 in August 2023 and further to 77 by September 2023.
Stability
- IBM’s Stability scores remained fairly consistent over time, maintaining a steady score of 53 from March 2023 to June 2023. There was a slight increase observed thereafter, with the score reaching 54 in July, 56 in August, and maintaining at 56 until September 2023.
While these three dimensions show the highest overall scores for IBM during the given periods, there is observable fluctuation, especially in the Growth dimension. This trend should be monitored in future observations.

How does International Business Machines Corporation (IBM) Stack Up Against its Peers?
Other stocks in the Technology – Services sector that may be worth considering are Serco Group plc (SCGPY), GigaCloud Technology Inc. (GCT), and NetScout Systems, Inc. (NTCT) – they have better POWR Ratings. Click here to explore more Technology – Services sector stocks.
What To Do Next?
Discover 10 widely held stocks that our proprietary model shows have tremendous downside potential. Please make sure none of these “death trap” stocks are lurking in your portfolio:
Want More Great Investing Ideas?
IBM shares were trading at $142.26 per share on Wednesday morning, down $0.98 (-0.68%). Year-to-date, IBM has gained 4.80%, versus a 12.34% rise in the benchmark S&P 500 index during the same period.
About the Author: Anushka Dutta

Anushka is an analyst whose interest in understanding the impact of broader economic changes on financial markets motivated her to pursue a career in investment research. More...
More Resources for the Stocks in this Article
| Ticker | POWR Rating | Industry Rank | Rank in Industry |
| IBM | Get Rating | Get Rating | Get Rating |
| SCGPY | Get Rating | Get Rating | Get Rating |
| GCT | Get Rating | Get Rating | Get Rating |
| NTCT | Get Rating | Get Rating | Get Rating |