International Business Machines Corporation (IBM): Price and Financial Metrics
IBM Price/Volume Stats
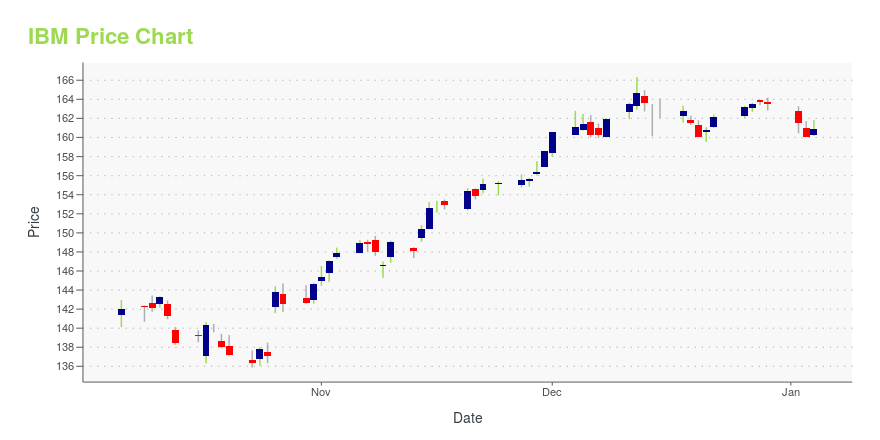
Current price | $160.56 | 52-week high | $162.79 |
Prev. close | $160.28 | 52-week low | $120.55 |
Day low | $159.97 | Volume | 2,100,233 |
Day high | $161.47 | Avg. volume | 4,454,687 |
50-day MA | $147.24 | Dividend yield | 4.12% |
200-day MA | $137.44 | Market Cap | 146.61B |
IBM Stock Price Chart Interactive Chart >
IBM POWR Grades
- IBM scores best on the Quality dimension, with a Quality rank ahead of 86.9% of US stocks.
- IBM's strongest trending metric is Growth; it's been moving down over the last 177 days.
- IBM ranks lowest in Sentiment; there it ranks in the 31st percentile.
IBM Stock Summary
- IBM has a higher market value than 98.71% of US stocks; more precisely, its current market capitalization is $146,601,188,180.
- IBM's went public 37.95 years ago, making it older than 93.02% of listed US stocks we're tracking.
- In terms of twelve month growth in earnings before interest and taxes, INTERNATIONAL BUSINESS MACHINES CORP is reporting a growth rate of 727.72%; that's higher than 98.24% of US stocks.
- Stocks with similar financial metrics, market capitalization, and price volatility to INTERNATIONAL BUSINESS MACHINES CORP are RTX, HON, DHR, INTU, and NOW.
- Visit IBM's SEC page to see the company's official filings. To visit the company's web site, go to www.ibm.com.
IBM Valuation Summary
- In comparison to the median Technology stock, IBM's price/sales ratio is 11.54% lower, now standing at 2.3.
- IBM's EV/EBIT ratio has moved up 0.7 over the prior 243 months.
Below are key valuation metrics over time for IBM.
Stock | Date | P/S | P/B | P/E | EV/EBIT |
---|---|---|---|---|---|
IBM | 2023-11-28 | 2.3 | 6.2 | 20.5 | 20.2 |
IBM | 2023-11-27 | 2.3 | 6.2 | 20.5 | 20.2 |
IBM | 2023-11-24 | 2.3 | 6.1 | 20.5 | 20.1 |
IBM | 2023-11-22 | 2.3 | 6.1 | 20.5 | 20.1 |
IBM | 2023-11-21 | 2.3 | 6.1 | 20.3 | 20.0 |
IBM | 2023-11-20 | 2.3 | 6.1 | 20.4 | 20.1 |
IBM Growth Metrics
- Its year over year cash and equivalents growth rate is now at -4.24%.
- Its 5 year net income to common stockholders growth rate is now at -22.34%.
- Its 3 year net cashflow from operations growth rate is now at -27.75%.

The table below shows IBM's growth in key financial areas (numbers in millions of US dollars).
Date | Revenue | Operating Cash Flow | Net Income to Common Stock |
---|---|---|---|
2022-09-30 | 47,096 | 9,014 | 1,262 |
2022-06-30 | 50,607 | 9,826 | 5,588 |
2022-03-31 | 53,817 | 11,130 | 5,521 |
2021-12-31 | 57,350 | 12,796 | 5,743 |
2021-09-30 | 74,460 | 16,112 | 4,766 |
2021-06-30 | 74,402 | 17,684 | 5,334 |
IBM's Quality Factors
The “Quality” component of the POWR Ratings focuses on 31 different factors of a companies fundamentals and operational strength. Here are some key insights as we drill into the specifics of these quality attributes.- IBM has a Quality Grade of B, ranking ahead of 89.89% of graded US stocks.
- IBM's asset turnover comes in at 0.491 -- ranking 64th of 83 Computers stocks.
- ATEN, FFIV, and ANET are the stocks whose asset turnover ratios are most correlated with IBM.
The table below shows IBM's key quality metrics over time.
Period | Asset Turnover | Gross Margin | ROIC |
---|---|---|---|
2021-06-30 | 0.491 | 0.486 | 0.074 |
2021-03-31 | 0.481 | 0.486 | 0.072 |
2020-12-31 | 0.477 | 0.483 | 0.061 |
2020-09-30 | 0.489 | 0.482 | 0.087 |
2020-06-30 | 0.496 | 0.478 | 0.084 |
2020-03-31 | 0.502 | 0.475 | 0.095 |
IBM Price Target
For more insight on analysts targets of IBM, see our IBM price target page. And for a list of of all stocks sorted by upside potential based on analyst target price, see our Top Price Target page.
Average Price Target | $150.00 | Average Broker Recommendation | 1.75 (Moderate Buy) |
International Business Machines Corporation (IBM) Company Bio
International Business Machines Corp was founded in 1911 in Endicott, New York. Headquartered in Armonk, New York, IBM offers a variety of IT services along with software, and hardware and also provides planning, build, manage, and maintain IT infrastructure, platforms, applications, and services. In 2020, IBM generated global revenues of nearly 73 billion U.S. dollars, of which 50 percent of this generated in the Americas region. The company spent 6.33 billion U.S. dollars in 2020 for research and development, specifically focused in the areas of artificial intelligence and hybrid cloud technologies. IBM employs nearly 350,000 individuals worldwide and the current Chairman and Chief Executive Officer is Arvind Krishna.
Latest IBM News From Around the Web
Below are the latest news stories about INTERNATIONAL BUSINESS MACHINES CORP that investors may wish to consider to help them evaluate IBM as an investment opportunity.
IBM Consulting and Palo Alto Networks Announce Expansion of Key Strategic Cybersecurity PartnershipIBM (NYSE: IBM) Consulting and Palo Alto Networks (NASDAQ: PANW) today announced that they will expand their strategic partnership to better enable clients to strengthen their end-to-end security postures and navigate evolving security threats. Palo Alto Networks, a global cybersecurity leader, will be in a select group of strategic IBM Consulting partners and IBM Consulting will be a premier security services partner for Palo Alto Networks. |
IBM Enhances Geospatial AI to Tackle Environmental ConcernsIBM is putting strong emphasis on the advancement of geospatial AI technologies. It has joined forces with NASA to develop an AI foundation model for weather and climate applications. |
3 Dividend-Paying Tech Stocks to Buy in DecemberDividend investors tend not to think about tech stocks when seeking income. Many emerging tech plays forgo dividend payments to invest in growth. Also, even when they pay dividends, they tend to have dividend yields below the S&P 500 average of 1.5%. |
International Business Machines Corporation (IBM) is Attracting Investor Attention: Here is What You Should KnowIBM (IBM) has been one of the stocks most watched by Zacks.com users lately. So, it is worth exploring what lies ahead for the stock. |
Midday movers: Uber, Spotify and more(Updated - December 4, 2023 12:11 PM EST) |
IBM Price Returns
1-mo | 9.10% |
3-mo | 9.95% |
6-mo | 21.40% |
1-year | 14.44% |
3-year | 55.99% |
5-year | 79.77% |
YTD | 19.62% |
2022 | 10.64% |
2021 | 16.76% |
2020 | -1.16% |
2019 | 23.58% |
2018 | -22.56% |
IBM Dividends
Ex-Dividend Date | Type | Payout Amount | Change | ||||||
---|---|---|---|---|---|---|---|---|---|
Loading, please wait... |
Continue Researching IBM
Here are a few links from around the web to help you further your research on International Business Machines Corp's stock as an investment opportunity:International Business Machines Corp (IBM) Stock Price | Nasdaq
International Business Machines Corp (IBM) Stock Quote, History and News - Yahoo Finance
International Business Machines Corp (IBM) Stock Price and Basic Information | MarketWatch
Loading social stream, please wait...