
The pain investors are feeling right now is horrifying to many. Less than a month ago the S&P 500 hit a record high on February 19th.
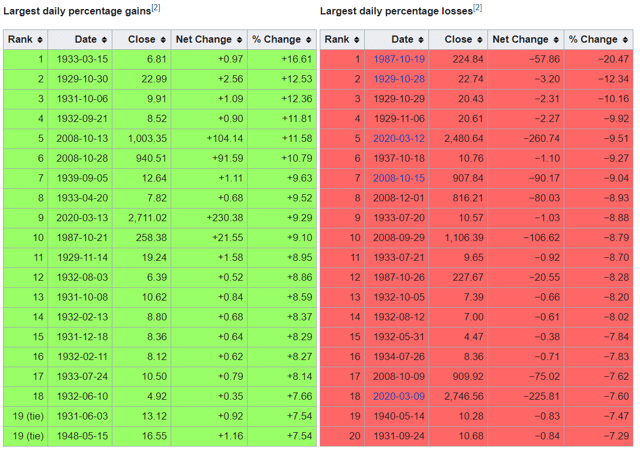
(Source: Wikipedia)
Yet in just the past week we’ve suffered two of the worst 20 days in market history, and as I write this, the market is on track to crack another top 10 daily decline.

(Source: Ycharts)
It’s bad enough for index investors who are down almost 26% in just over three weeks. But for energy investors or shareholders in Carnival or Boeing?
Well, you can understand why so many feel a sense of hopelessness and so badly want to know “when will the pain stop!”
While no one can predict when a pandemic, global recession or bear market will end with precision here is the best information we have available today, to hopefully answer those questions and give hope to anyone rapidly running out of it.
Here’s What We Can Potentially Expect From the Pandemic in Coming Weeks
I’m tracking the pandemic daily, using two models, based on a bullish and conservative (bearish) case. Here’s the conservative model, which uses the country with the highest case rate in the world, currently Italy.
COVID-19 Final Case Forecast Conservative Case
| Country | Population | Cases | Population/Cases | Projected Final Cases |
| China | 1386000000 | 80860 | 17141 | NA |
| US | 327200000 | 3782 | 86515 | 133883 |
| Italy | 60480000 | 24747 | 2444 | NA |
| Iran | 81160000 | 13938 | 5823 | 33209 |
| South Korea | 51470000 | 8236 | 6249 | 21060 |
| Spain | 46660000 | 7988 | 5841 | 19092 |
| France | 66990000 | 5423 | 12353 | 27411 |
| Germany | 82790000 | 5813 | 14242 | 33876 |
| Switzerland | 8570000 | 2217 | 3866 | 3507 |
| Japan | 126800000 | 840 | 150952 | 51884 |
| Norway | 5368000 | 1256 | 4274 | 2196 |
| Netherlands | 17180000 | 1135 | 15137 | 7030 |
| UK | 66440000 | 1391 | 47764 | 27186 |
| Sweden | 10120000 | 1040 | 9731 | 4141 |
| Denmark | 5603000 | 864 | 6485 | 2293 |
| Belgium | 11400000 | 886 | 12867 | 4665 |
| Austria | 8822000 | 860 | 10258 | 3610 |
| World | 7,771,000,000 | 157393 | 49373 | 3179711 |
(Sources: Johns Hopkins, World of Meters, WHO, CDC, Census Bureau)
The conservative model uses actual confirmed case data to update daily the final amount of cases we might expect if every country on earth ended up as bad off as Italy (or whatever country has the highest case rate).
As of March 16th, we’re potentially looking at 3.2+ million cases and that estimate rises daily since Italy has yet to get its epidemic under control.

(Source: World Of Meters)
Don’t get me wrong, Italy has pulled out all the stops. On March 9th it locked its economy down, including closing all non-essential businesses.
It’s testing everyone like mad BUT given the WHO’s average 5 day incubation period and 14-day average case duration, it might take until late March before daily new cases peak and begin declining.
As I write this there are just 3,233 new cases reported on March 16th, which MIGHT indicate that peak new cases were on March 15th. However, it will take at least a week to confirm that the worst is over for Italy, which will give us some idea for what the rest of Western Europe might be in for.
The good news is that China proves that severe lockdowns do work.
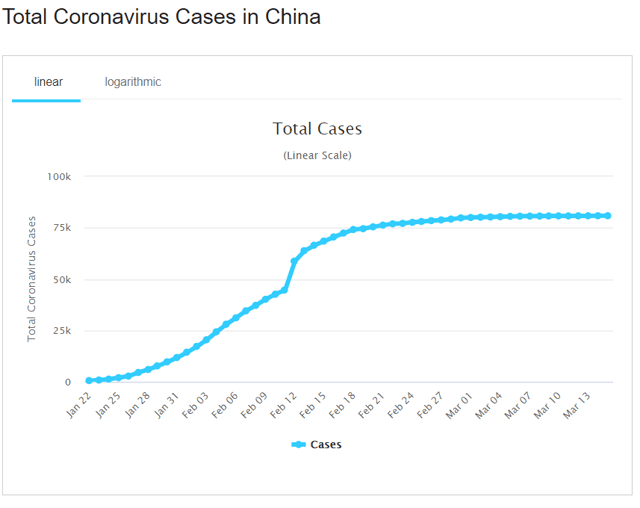
(Source: World Of Meters)
The bad news is that the short-term economic effects of such measures can be brutal.
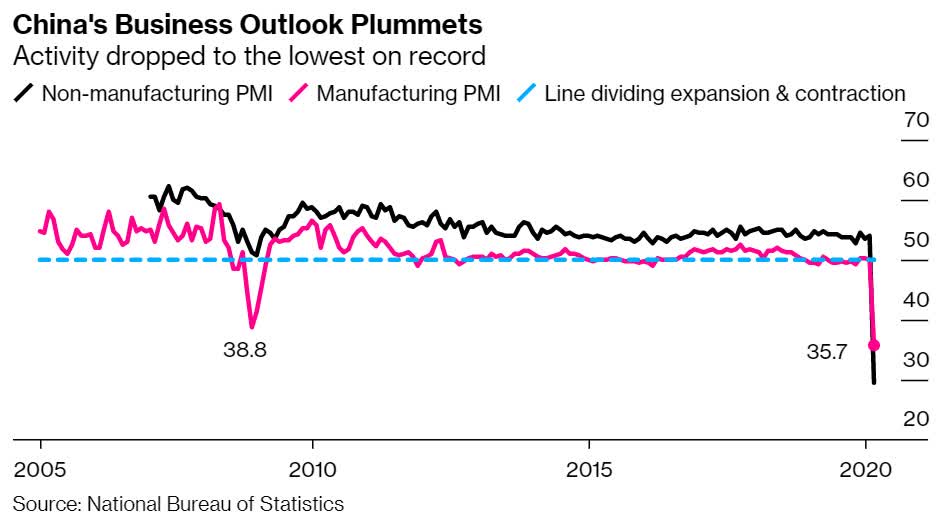
(Source: Bloomberg)
Cohen & Steers has estimated three cases for how the pandemic might play out globally.
Due to the significant uncertainty in these measures, Cohen & Steers outlined these three potential scenarios:
Scenario A: Containment by the end of March. New global cases begin to fall by the end of March. Global growth takes a modest hit but recovers quickly.
Scenario B: Escalation into the second quarter. New cases continue to rise until May, disrupting activity both on the supply and demand side for several months before rebounding in the third quarter. Central banks respond with emergency interest-rate cuts and fiscal authorities begin easing measures. In the short term, the impact on growth could come close to the dot-com recession in 2000 but should not be as bad as the 2008–09 financial crisis, with a near-term impact on job growth and consumer confidence.
Scenario C: Global escalation and demand destruction. The virus continues to escalate into the third quarter across all major economies. Profits contract for a sustained period, the global unemployment rate rises, consumer confidence falls sharply and retail sales contract. Central banks coordinate monetary easing and provide liquidity to keep lending channels flowing. This could lead to a global recession (two quarters of negative growth) before rebounding in the fourth quarter.
Cohen & Steers believes that “Scenario B is the most likely outcome, with the potential for Scenario C.” The silver lining is that financial balances are generally strong, monetary policy is loose, inflation is under control and there are no major inventory overhangs, which should help boost the economy in the recovery phase.” – Brad Thomas (emphasis original)
OK, so the pandemic is likely to last a few months. But what investors really want to know is how bad will the pain become? Will stocks keep crashing until May, June or July? Here there is some good and bad news.
Here’s When the Market Might Bottom…And Potentially Start an Epic Rally
On March 13th, Bank of America Global Research put out a note that indicated its latest economic forecasts.
The economy will flirt with a recession in the coming months with negative GDP in 2Q, we believe…Growth is expected to remain soft in 3Q with recovery starting thereafter. Get ready for disinflation – headline slowing notably and core remaining below target. An aggressive policy response is needed.”
The firm cut its growth forecast for the second quarter to negative 0.5% from 1%, The economists now expect a return to very sluggish growth of just 0.3% for Q3 GDP and a rebound to 1.8% in the fourth quarter. BofA now expects 2020 growth of 1.2% and 1.5% next year.” – CNBC (emphasis added)
Right now the gold standard of economic models is based on high-frequency indicators, reports that come in on a weekly basis.
Bank of America estimates that the US will get just one-quarter of mildly negative growth, followed by a relatively tepid but steady recovery.
The US economy could shrink by 2% in the first quarter and 3% in the second, JPMorgan projected, while the eurozone economy could contract by 1.8% and 3.3% in the same periods…
COVID-19 is expected to roll through the global economy over February, March, and April, generating GDP contractions in most countries for at least one of the two quarters it straddles,” Bruce Kasman, JPMorgan’s chief economist, said in a note. “If our current forecast is realized it seems appropriate to characterize it as a novel-global recession…
Our forecast for a mid-year growth rebound would not fit the NBER criteria that recessions should last for more than a few months.
JPMorgan expects a fading of the coronavirus outbreak to promote a recovery in activity into midyear 2020, followed by an acceleration in growth in the second half of the year. ” – CNBC (emphasis added)
JPMorgan’s economic team rated as one of the 16 most accurate in America by MarketWatch, expects a sharper technical recession, though not an official one as declared by the National Bureau of Economic Research.
JPMorgan does believe that a recovery, created by trillions in monetary and fiscal stimulus will be sharper than what BAC estimates are coming.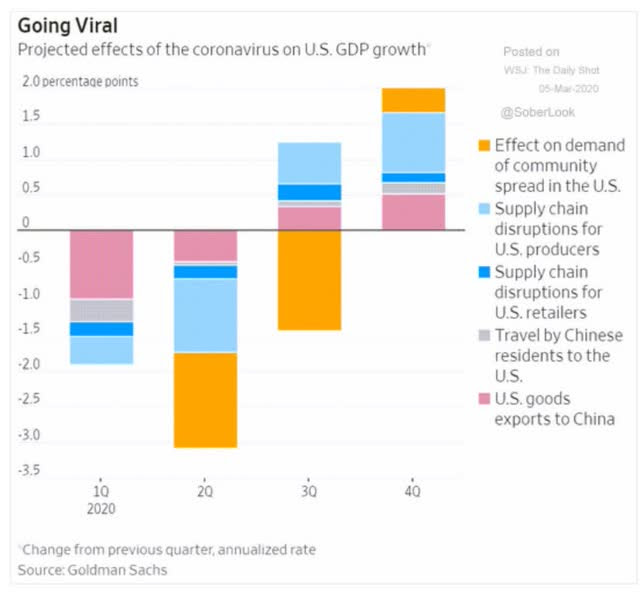
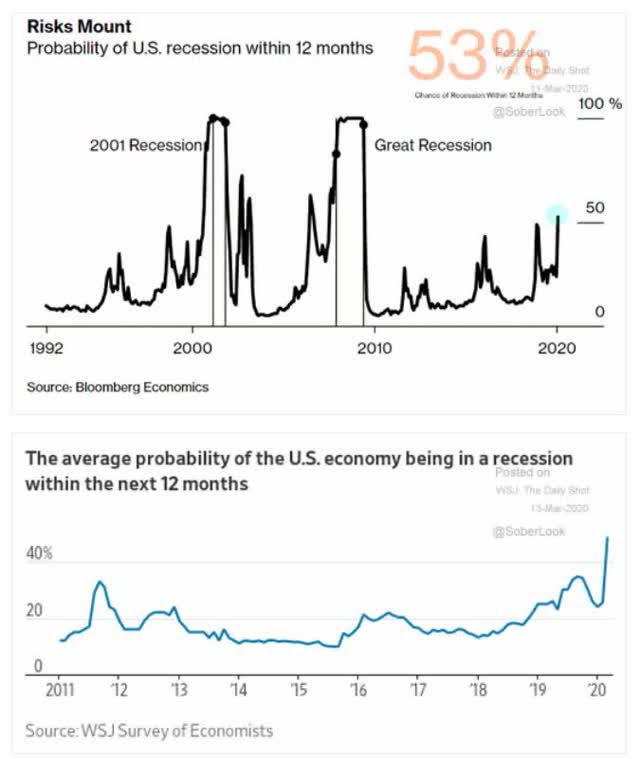
Goldman is in between, estimating a strong recovery in Q4, and about 53% chance of a technical recession this year.
Ok, so that’s what the best available high-frequency data models tell us right now.
But what about the stock market? When will that stop crashing? The good news is that, as we’ve seen during this bear market, the market, even when in a panic, doesn’t go straight down.

(Source: Advisor Perspectives)
The worst days for stocks are often followed by the best days, which BAC’s quants tell us.
Looking at data going back to 1930, Bank of America found that if an investor missed the S&P 500′s 10 best days in each decade, total returns would be just 91%, significantly below the 14,962% return for investors who held steady through the downturns.
The firm noted this eye-popping stat while urging investors to “avoid panic selling,” pointing out that the “best days generally follow the worst days for stocks.” -CNBC
In other words, bear market rallies are very real and can be very impressive, if perhaps offering false hope that makes timing the bottom all but impossible.
Bear Market Rallies During 2000 Tech Crash

(Source: Michael Batnick)
Bear Market Rallies During Financial Crisis

(Source: Michael Batnick)
During the Financial Crisis stocks rallied as much as 24.2% off their lows, making many think the worst was over. Then the final plunge happened.
But unfortunately for those who plan to wait for the “dust to settle” that doesn’t work either.
Today is March 9th. Precisely eleven years ago today, in 2009, the stock market stopped going down. There was no reason. The dust had settled, without fanfare or any sort of official announcement. If you had polled people that day, or week or even month, most would not have agreed that we had seen the worst.
The economic headlines were not improving. But there it was. And by June 1st, less than 3 months later, the stock market had climbed 41% from that March low. And even with that having happened, the majority of participants still weren’t clear that the dust had fully settled. That we had, in fact, seen the worst.” – Joshua Brown
There is no bell rung at the bottom, and the only way you know for sure a bear market is over is when the market hits new record highs.
Ok, so then the question is how bad could this get before it’s at least likely to bottom? Even an educated guesstimate might prove useful, or at least given bulls something to cling to in these dark times.
Goldman Sachs has updated its bear market model for the following ranges.
- base case -5% EPS growth this year
- base case: 2450 S&P 500 bottom by mid-year (-27% bear market peak decline)
- median worst-case decline: -41% (S&P 500 2000)
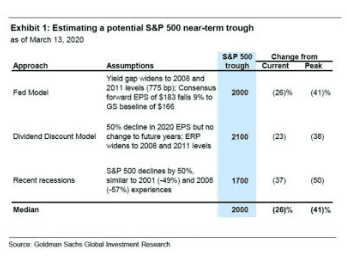
- 3,200 S&P 500 by end of the year (V-shaped recovery, 31% to 60% rally in the second half of the year)
Here’s what Goldman thinks is most likely, based on the best available data its quants have fed into their supercomputers.
Do I believe that a 27% to 41% bear market bottom is reasonable?
I think it’s at least plausible, using the best available EPS growth estimates I’ve collected so far from Goldman, Bank of New York Mellon, Lipper Financial, FactSet, as well as historical recessionary EPS declines (-13% average since 1945).
We can run the numbers on Goldman’s estimated 2,000 to 2,450 market bottom and see that
- 2450 S&P bottom would mean a 14.2 to 17.1 forward PE on S&P 500 vs 16.3 25-year average
- 2000 S&P bottom would mean 11.6 to 13.9 forward PE on S&P 500 vs 13.0 average modern era bear market bottoms (excluding Financial Crisis)
- 12.4 forward PE would equal the average 36.6% PE contraction seen in modern bear markets
What about the timing predictions Goldman is offering? That we bottom in May or June (and with plenty of bear market rallies to give longs a breather) before stocks kick off a 30% to 60% rally that allows the market to finish relatively flat for the year?
That’s speculative of course, but I can see a plausible scenario for that as well
- peak global cases occur in April/May
- by May/June the pandemic is ebbing
- Locked down countries like Italy begin restarting their economies by May/June
- US corporate earnings in Q2 (Goldman is estimating -15% growth) beat very pessimistic expectations (as they do about 75% of the time since 2000).
- Fiscal stimulus bills currently running through Congress + the Fed’s $5 to $6 trillion in bond-buying help minimize the economic damage (potentially even limiting negative growth to just one quarter)
Obviously, a lot has to go right for Goldman’s bullish forecast to come true. If the pandemic keeps rolling on through Q3 and even potentially Q4 then stocks might end up hitting the -50% Goldman worst-case scenario.

Another reason I consider Goldman’s -27% to -41% bear market peak decline forecast reasonable is because that’s roughly in line with historical bear markets.
Yes, every downturn is caused by a different catalyst. However, every bear market is ultimately caused by market fears of falling fundamentals and ends when sentiment has hit a level so bearish, that investors capitulate and give up hope of stocks ever recovering.
(Source: Guggenheim Partners, Ned Davis Research)
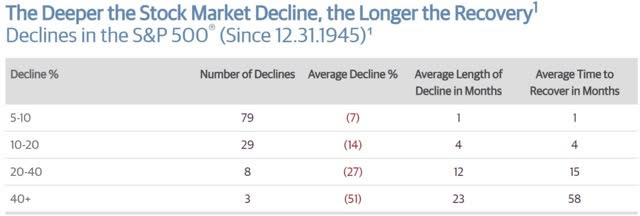
How long might it take the market to recover to fresh highs? Outside of 40+% market crashes that are the result of a massive and sustained shock (Financial Crisis, Sustained high oil prices, or the biggest bubble in US market history), bear markets tend to take 15 months for peak highs to be seen after stocks bottom.
It’s always possible that this one might take longer. However, given the speed with which the current declines have hit, and the fact that the catalyst is likely to be gone by next year, I think it’s plausible that Goldman’s prediction of 3,200 S&P 500 by the end of the year could prove relatively accurate.
And I certainly wouldn’t be surprised if 2021 ends up being a banner year for stocks, with the market hitting record highs by the end of that year.
Bottom Line: As Bad as This Feels Right Now, It Will Pass And By 2021 Stocks Could Be at Record Highs Once More
I totally understand why many investors today have a sense of hopelessness and outright despair.
With stocks seemingly acting crazy, and crashing by 5% to 15% (or more) every day it’s easy to lose faith in the long-term growth of the economy and corporate earnings.
However, the good news is that, while we don’t know precisely when the pandemic will end, it’s guaranteed that it eventually will.
The same fiscal/monetary stimulus that governments around the world are currently racing to enact, which has sent the markets crashing in a panic, is also what could deliver a robust economic recovery in the latter half of the year.
(Source: imgflip)
While I can’t tell you if Goldman Sach’s is right that stocks will bottom in mid-2020, and then rally 30% to 60% in the latter half of the year, I can tell you that most likely the effects of the coronavirus will be gone by 2021.

Thus stocks could easily return to record levels by the end of next year. Those who were brave and patient enough to outlast the panic could end up sitting on monster gains, that few investors dare to dream of in today’s turbulent market.

(Source: AZ quotes)
.INX shares were trading at $238.46 per share on Wednesday morning, down $14.34 (-5.67%). Year-to-date, .INX has declined -25.91%, versus a % rise in the benchmark S&P 500 index during the same period.
About the Author: Adam Galas

Adam has spent years as a writer for The Motley Fool, Simply Safe Dividends, Seeking Alpha, and Dividend Sensei. His goal is to help people learn how to harness the power of dividend growth investing. Learn more about Adam’s background, along with links to his most recent articles. More...
More Resources for the Stocks in this Article
| Ticker | POWR Rating | Industry Rank | Rank in Industry |
| .INX | Get Rating | Get Rating | Get Rating |


