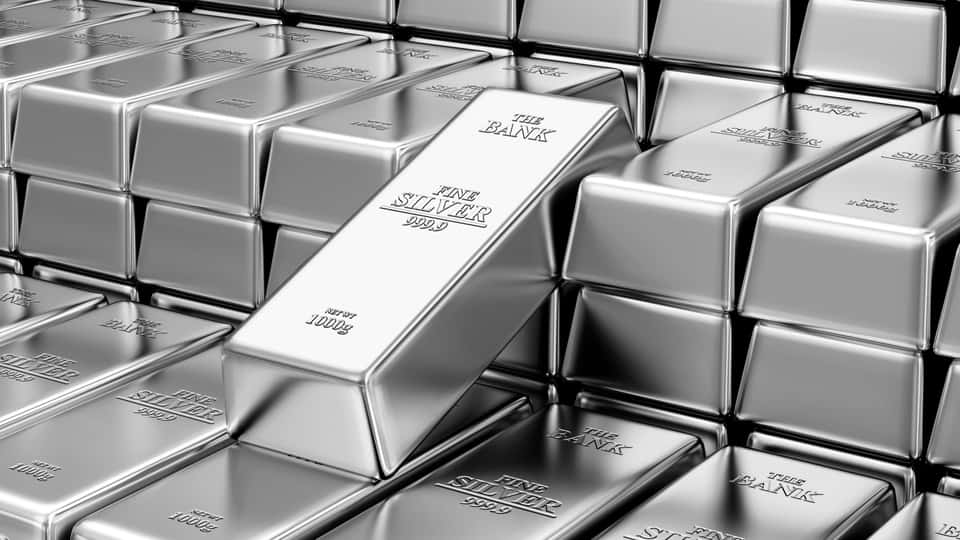
It’s been a rough couple of months for investors in the silver (SLV) as we’ve seen the metal slide nearly 30% from its highs in a span of less than 50 trading days. This is quite similar to how the metal acted heading into the 2016 Presidential Election, topping in late Q3 and beginning a steep downtrend since. Fortunately, the metal has held onto pivotal support this time around and remains above its key weekly moving averages.
This suggests that there’s no reason to count out silver here, even if the metal might look it’s on the ropes. However, this view is contingent on the metal holding $21.50/oz on a weekly close, as a drop beneath this level would be a bearish development. Let’s take a closer look below:
(Source: Daily Sentiment Index Data, Author’s Chart)
Beginning with bullish sentiment for silver, we’ve seen a significant improvement over the past few weeks, with the 16-week moving average falling from 86% bulls to 55% bulls, a drop of over 3000 basis points.
This has moved sentiment from a contrarian bearish reading due to excessive optimism back to a neutral reading, with an even divide between bulls and bears. However, as I’ve pointed out previously, daily sentiment readings have not dropped beneath the 30% level for more than a day, and this is very unusual after a drop of more than 25% in an asset class. If we compare this to gold (GLD), the metal saw a reading of 22% bulls last week despite a drop of only 11% from its highs.
Therefore, while sentiment has certainly improved and is no longer a headwind to future rallies, I would much prefer to see signs of capitulation. This would increase the probability that the September 25th low near $22.00/oz will hold.
(Source: TC2000.com)
Moving over to the Silver vs. Gold ratio, we can see that the trend remains bullish, despite the recent decline in silver prices. As shown above, the ratio crossed above its key moving monthly moving average in August, and the recent pullback merely back-tested this moving average.
Generally, both metals perform much better when silver is outperforming gold, so this is a positive sign. However, a break back below this indicator would likely occur if silver were to drop below $21.50/oz. This would be a very negative development as it would be reminiscent of the slight break of this moving average in 2016 that immediately reversed.
(Source: TC2000.com)
Finally, from a technical picture, we can see that the bears remain in control of the short-term time frames, even if the bulls have a long-term breakout working in their favor. As the 4-hour chart above shows, the bulls have pivotal support at $21.50/oz but strong resistance at $26.55/oz. Until silver can get back above $26.55/oz on a weekly closing basis, there is no reason to believe that this correction is over. Given that we remain in a downward trend with no evidence of capitulation from a sentiment standpoint, it makes little sense to be aggressively buying here.
So, what’s the best course of action?
As noted in prior updates, I remain long gold as it’s the strongest metal currently, and it was the first metal to make new all-time highs earlier this year. When it comes to silver, I much prefer the silver miners to silver itself, as many silver miners are within 15% of their all-time highs, while silver is still 50% below its prior all-time highs near $50.00/oz.
I prefer to be long the assets with the least resistance overhead, which is why I believe an investment in Pan American Silver (PAAS) makes much more sense than silver, as it is stronger than the metal, and it comes with a dividend yield of 0.90%, that’s likely to increase further in FY2021.
For now, I see no reason to increase positions in silver, but I remain long gold and Pan American Silver, as well as several other gold miners like Kirkland Lake Gold (KL). If we were to see silver break out above $26.55/oz, this would increase the probability that the correction is over, and this would justify adding exposure to silver miners or the metal.
Disclosure: I am long GLD, PAAS
Disclaimer: Taylor Dart is not a Registered Investment Advisor or Financial Planner. This writing is for informational purposes only. It does not constitute an offer to sell, a solicitation to buy, or a recommendation regarding any securities transaction. The information contained in this writing should not be construed as financial or investment advice on any subject matter. Taylor Dart expressly disclaims all liability in respect to actions taken based on any or all of the information on this writing.
Want More Great Investing Ideas?
Top 11 Picks for Today’s Market
7 Best ETFs for the NEXT Bull Market
5 WINNING Stocks Chart Patterns
SLV shares were trading at $23.00 per share on Thursday morning, down $0.29 (-1.25%). Year-to-date, SLV has gained 37.89%, versus a 8.25% rise in the benchmark S&P 500 index during the same period.
About the Author: Taylor Dart

Taylor has over a decade of investing experience, with a special focus on the precious metals sector. In addition to working with ETFDailyNews, he is a prominent writer on Seeking Alpha. Learn more about Taylor’s background, along with links to his most recent articles. More...
More Resources for the Stocks in this Article
| Ticker | POWR Rating | Industry Rank | Rank in Industry |
| SLV | Get Rating | Get Rating | Get Rating |
| KL | Get Rating | Get Rating | Get Rating |
| PAAS | Get Rating | Get Rating | Get Rating |


