The stock market is always climbing a wall of worry, even in the roaring 90’s.
(Source: Michael Batnick)
Since 2009 and 1945 we’ve averaged a 5+% pullback or correction in the S&P 500 every six months.
- this is the approximate frequency of market pullbacks that is likely to persist for the foreseeable future
- the cost of owning the best performing asset class in history
- smart long-term investors (DK members) harness this short-term volatility for their benefit
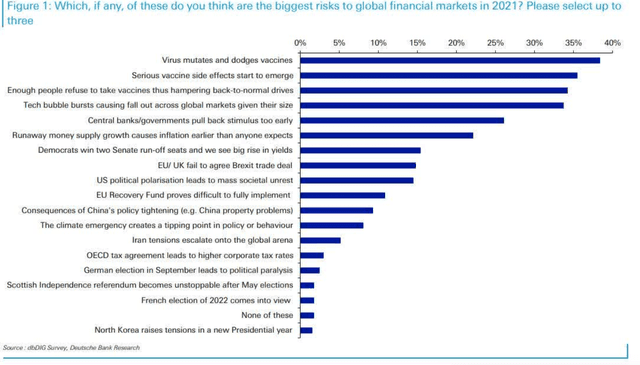
What makes up the Wall of worry today? Here’s a survey from Deutsche Bank.
(Source: Lance Roberts)
The current Wall of Worry consists mainly of vaccine/pandemic related potential bad things happening and insufficient fiscal and monetary stimulus.
- these short-term risk factors are the potential catalysts for flipping Wall Street from “risk-on” to “risk-off”.
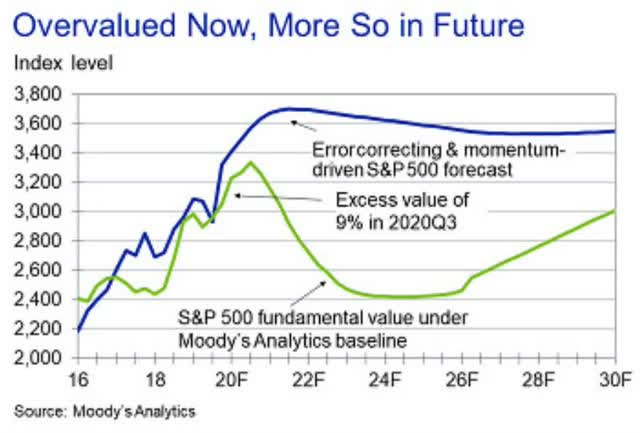
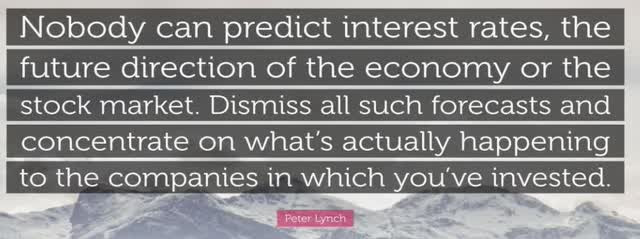
In the short-term no-one can predict the stock market, because just 8% of returns are a function of fundamentals, according to JPMorgan. Moody’s, a blue-chip economist/analyst firm, has a base case forecast predicting a multi-year bear market beginning in early 2021
Goldman Sachs, another blue-chip economist/analyst firm, predicts stocks will rally to 4,600 on the S&P 500 (up 25%) by the end of 2022.
JPMorgan, another blue-chip economist, thinks stocks could hit 4,600 by the end of 2021.
Bank of America, another blue-chip economist, thinks stocks will post modest gains that disappoint many.
“Bank of America expects global GDP to grow 5.4% in the next year, while the US economy grows 4.5%. The S&P 500 will rise roughly 5% to 3,800, and the 10-year Treasury yield will climb to 1.5%, according to the firm’s outlook note.” – Business Insider
All four of these economist/analyst firms are among the 16 most accurate out of 45 tracked by MarketWatch. How can they differ so greatly in their forecasts for the stock market? Because forecasting the short-term future is nearly impossible.
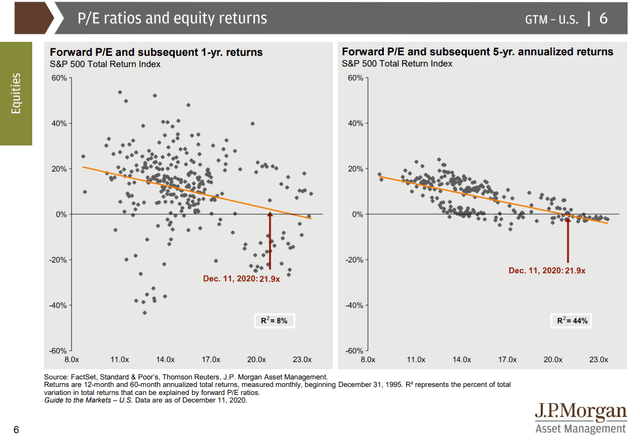
According to JPMorgan, just 8% of 12-month stock returns are a function of fundamentals, meaning earnings growth and valuations. You can see that by how wide the 12-month return range is since 1995. By five years the range gets much narrow, with 44% of returns a function of fundamentals.
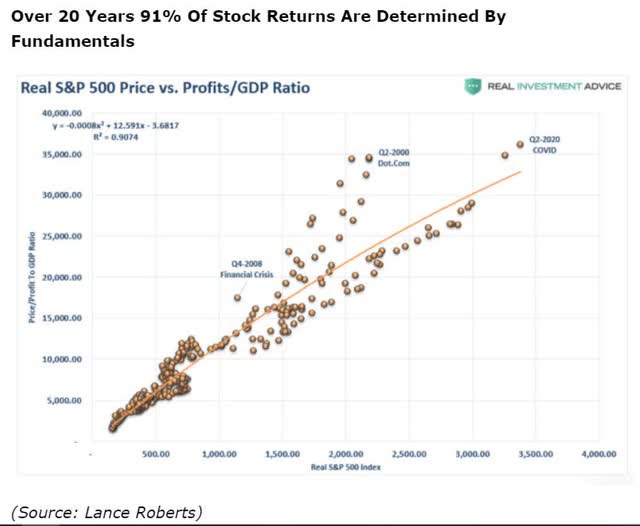
By 20 years 91% of returns are a function of fundamentals. The fact that the “long-term” is far longer than most people realize is how market bubbles can form, and last for years.
- Robert Schiller and Fed Chairman Alan Greenspan both called the tech bubble in 1996
- the bubble continued until March 2000
- along the way the Nasdaq fell 17% three times from 1997 to 2000 without suffering a bear market
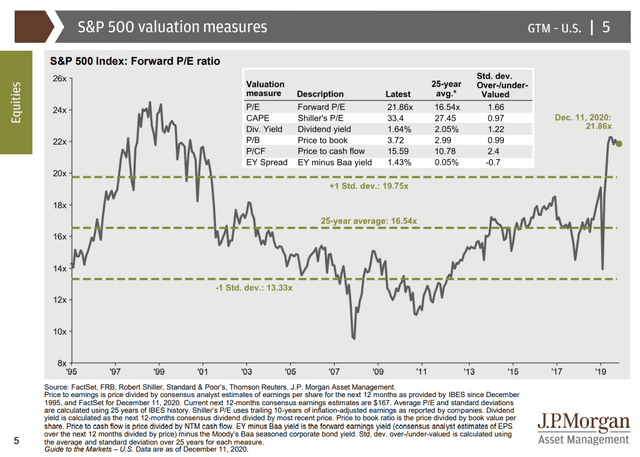
That’s both good and bad news for investors who were traumatized by the fastest bear market back in March.
Speculative Manias Are All Around Us
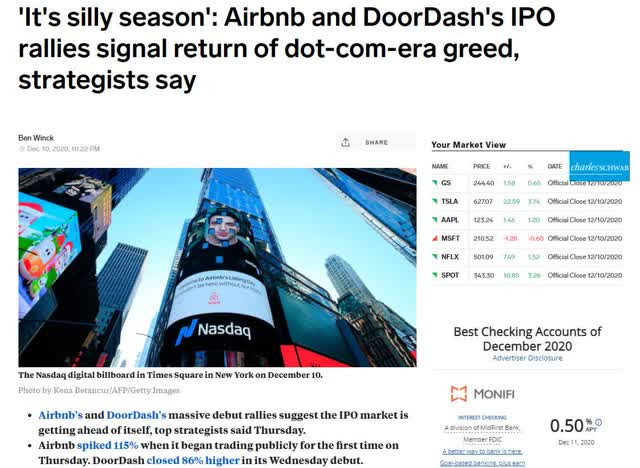
(Source: Business Insider)
It’s a record year for IPOs, in terms of how much money has been raised by companies. That includes companies with questionable moats, no profits, and that some analysts think will never actually turn a profit.
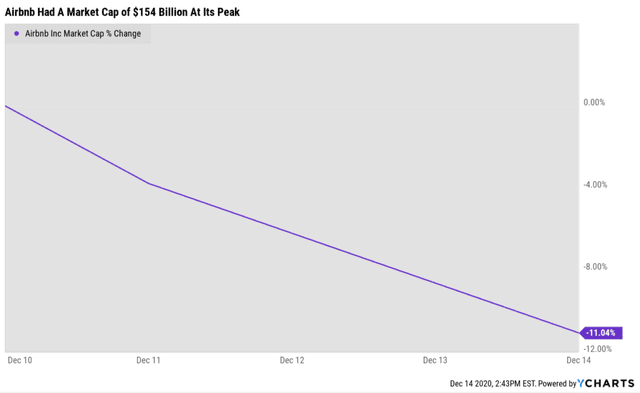
Airbnb (ABNB - Get Rating) was valued at $154 billion at its peak. There was a 91% probability that paying such insane valuations for a non-profitable company that might never actually turn a profit was likely to end badly.
“The average IPO this year has enjoyed a 41% first-day return, according to data compiled by University of Florida professor and IPO expert Jay Ritter — the highest mark since 2000, when IPOs jumped 56% on average amid the dotcom bubble.
The record high — a 71% average first-day bump — came in 1999.
The IPO market has notched other staggering figures this year as well, with nearly 430 deals, the most since 2000, and $160 billion in deal value, an all-time high, according to data from Dealogic.” – Business Insider
What does this mean for investors? That you have to be more careful than ever with your money.
The #1 Way To Avoid Losing Your Shirt In This Bubble
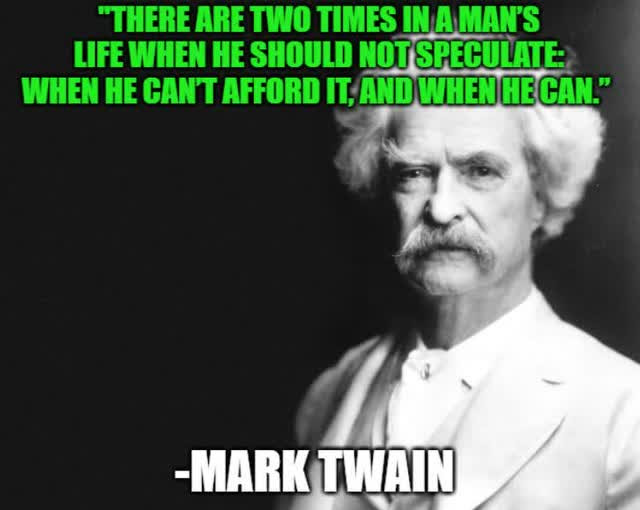
(Source: imgflip)
Speculation is all about making short-term bets about where stocks will go based almost entirely on fickle sentiment.
For example, Tesla (TSLA - Get Rating) is slated to join the S&P 500 on December 21st at the opening bell.
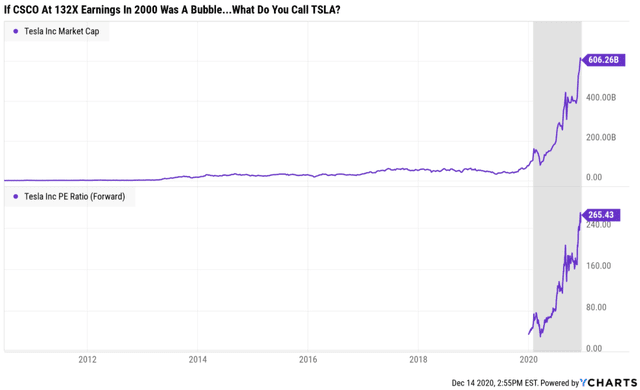
When Tesla joins the S&P 500, eventually over 3,000 funds and ETFs will have to buy it. The greater the market cap the more Tesla these funds will need to buy. How much more?
- six months ago the figure was $34 billion
- today its about $80 billion
“According to Howard Silverblatt, senior index analyst at S&P Dow Jones Indices, $80 billion worth of Tesla stock will have to be bought by index investors. He noted that trading volatility could be exacerbated by Tesla not being a member of the S&P 1500, S&P 400 Midcap, or S&P 600 Small-Cap indices.
Fund managers that must buy the index will try to buy Tesla as near the Dec. 18 closing price as possible. “It’s probably going to be one of the biggest market on close buy orders of all time,” said Peter Boockvar, chief investment strategist at Bleakley Advisory Group.” – CNBC (emphasis added)
Traders are trying to front-run the big money managers who will be forced buyers of Tesla in the coming days. This is what’s driving the stock to such absurd levels.
Think that making a quick buck on Tesla is a “sure thing”? Be careful because you simply can’t know just how much of the money flowing into Tesla on any given day is speculator money and how much is institutional funds trying to avoid becoming forced buyers on December 18th.
- Tesla might peak before December 18th
Are there some analysts that think Tesla’s rally might be just beginning? Sure, some even think it could quadruple from here, to a market cap of almost $2.5 trillion. And if JPMorgan is right and vaccines + big stimulus causes the market to melt-up 25% in 2021 it’s possible that the tech bubble could keep inflating.
The more money that pours into the S&P 500 would end up going to the most popular stocks, since its a market-cap-weighted index. But that doesn’t mean that the bubble isn’t a bubble, it just means we can’t know when it will end, or what will cause market sentiment to do a 180.
In my next article, I’ll show you which companies are not only safe to buy in today’s market, but which are likely to soar and make you rich, even while so many other short-term speculators end up losing their shirts.
Want More Great Investing Ideas?
9 “MUST OWN” Growth Stocks for 2021
Chart of the Day- See Christian Tharp’s Stocks Ready to Breakout
SPY shares were trading at $370.27 per share on Wednesday morning, up $0.68 (+0.18%). Year-to-date, SPY has gained 16.69%, versus a % rise in the benchmark S&P 500 index during the same period.
About the Author: Adam Galas

Adam has spent years as a writer for The Motley Fool, Simply Safe Dividends, Seeking Alpha, and Dividend Sensei. His goal is to help people learn how to harness the power of dividend growth investing. Learn more about Adam’s background, along with links to his most recent articles. More...
More Resources for the Stocks in this Article
| Ticker | POWR Rating | Industry Rank | Rank in Industry |
| SPY | Get Rating | Get Rating | Get Rating |
| ABNB | Get Rating | Get Rating | Get Rating |
| TSLA | Get Rating | Get Rating | Get Rating |

