

The perfectly normal, healthy, and expected market pullback is picking up steam, causing many investors to worry a correction or even a new bear market is upon us.
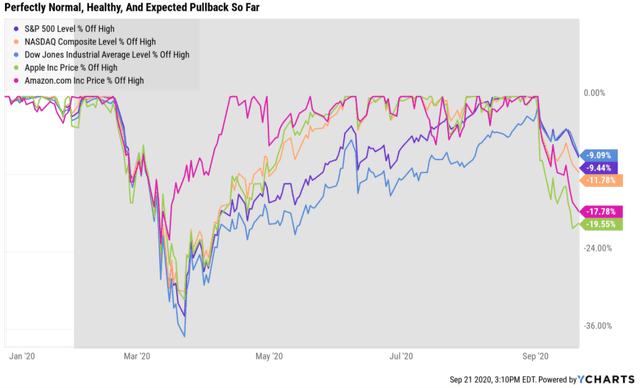
The S&P 500 is down 9.4% from its record highs set on September 2nd, while the Nasdaq is in a correction. Beloved tech names like Apple and Amazon, are flirting with bear market territory. There are many competing analysts out there would tell you either this is a classic “buy the dip” moment, or the start of “the big one”, an epic market crash that could mirror the epic 50% market decline following the popping of the tech bubble. For example, supporting the “buy the dip” argument are such cherry-picked facts as
- from 1997 to 2000 the Nasdaq suffered three 17% corrections and the tech bubble didn’t pop
- Friday, September 18th was quarterly options expiration day, and the last two bear markets both bottomed the day after option expiration
On the other hand,
- JPMorgan Asset Management estimates that if we get a double-dip recession (economy is showing signs of weakening again), then stocks could fall 22%, another 145 lower
- Ned Davis Research says it’s base case scenario is that this is a 15% to 20% correction (so about half over)
- Tech bubble 2.0 valuations mean that stocks COULD fall into a bear market right now, rather than reflate the bubble as occurred between 1997 to 2000
Rather than try to pretend like I know where the market’s headed next, let me simply point out the strongest proof that this current market downturn is totally meaningless, and thus something prudent long-term investors need to ignore if they want to actually accomplish their financial goals.
The Ultimate Proof This Market Decline Is Meaningless And Not A Threat To Your Retirement Portfolio
According to Ben Carlson of Ritholtz Wealth Management, if a company generates zero earnings for an entire year that will reduce its intrinsic value by 10%. That’s based on the most fundamental principle in investing, that intrinsic value is a result of future earnings and cash flows discounted to the present. Why does this matter to you during this market pullback/correction?
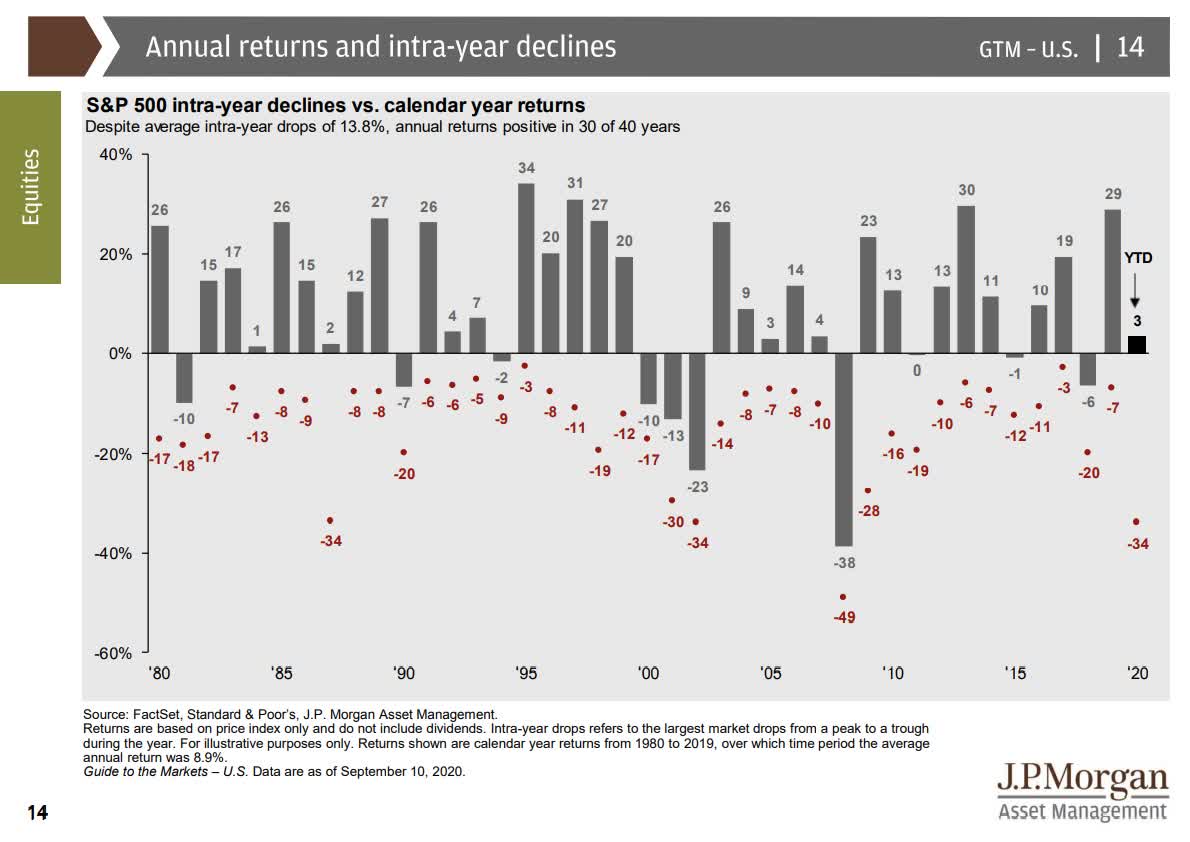
Because since 1980 the average peak intra-year decline for the S&P 500 has been 13.8%. This has two important implications that will make all the difference in whether you achieve your financial goals or wind up losing painful amounts of money in market declines. First, a 14% market decline should be something every investor expects in any given year. Second, the fact that the market’s average annual volatility is also 14% to 15% over time proves that in the short-term the market is not only wrong but hilariously so.
Think of it like this:
- during the pandemic lockdown, some businesses were completely closed
- the S&P 500 this year is expected to report an 18% EPS decline
- even if the S&P 500 reported ZERO profits this year the fundamentally justified decline for stocks would be 10% (decrease in intrinsic value)
- stocks average a 14% every single year (representing 1.4 years worth of zero earnings)
- individual stocks can fall as much as 20+% in a single day (representing 2+ years of zero earnings)
The 34% decline we saw in March took the market from about 15% overvalued to 15% undervalued. The five-month rally that followed took stocks from 15% undervalued to 49% historically overvalued.
(Source: Imgflip)
Do you know how much of any given YEAR’s returns are a function of fundamentals?

8%. Over five years that rises to 44%. In other words, the “long-term” is a lot longer than most people realize.
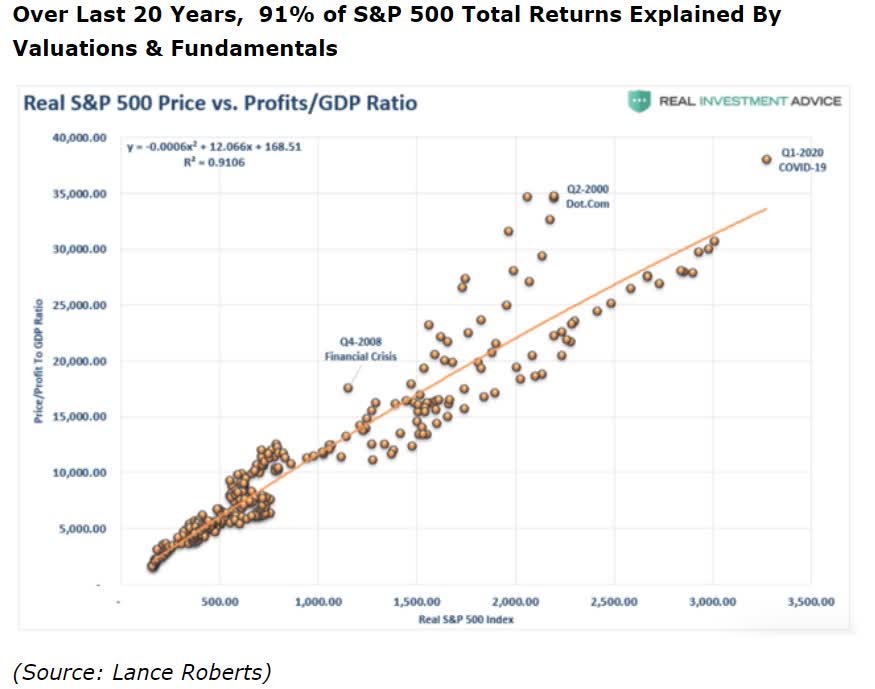
Over 10+ years 90% to 91% of returns are a function of fundamentals.
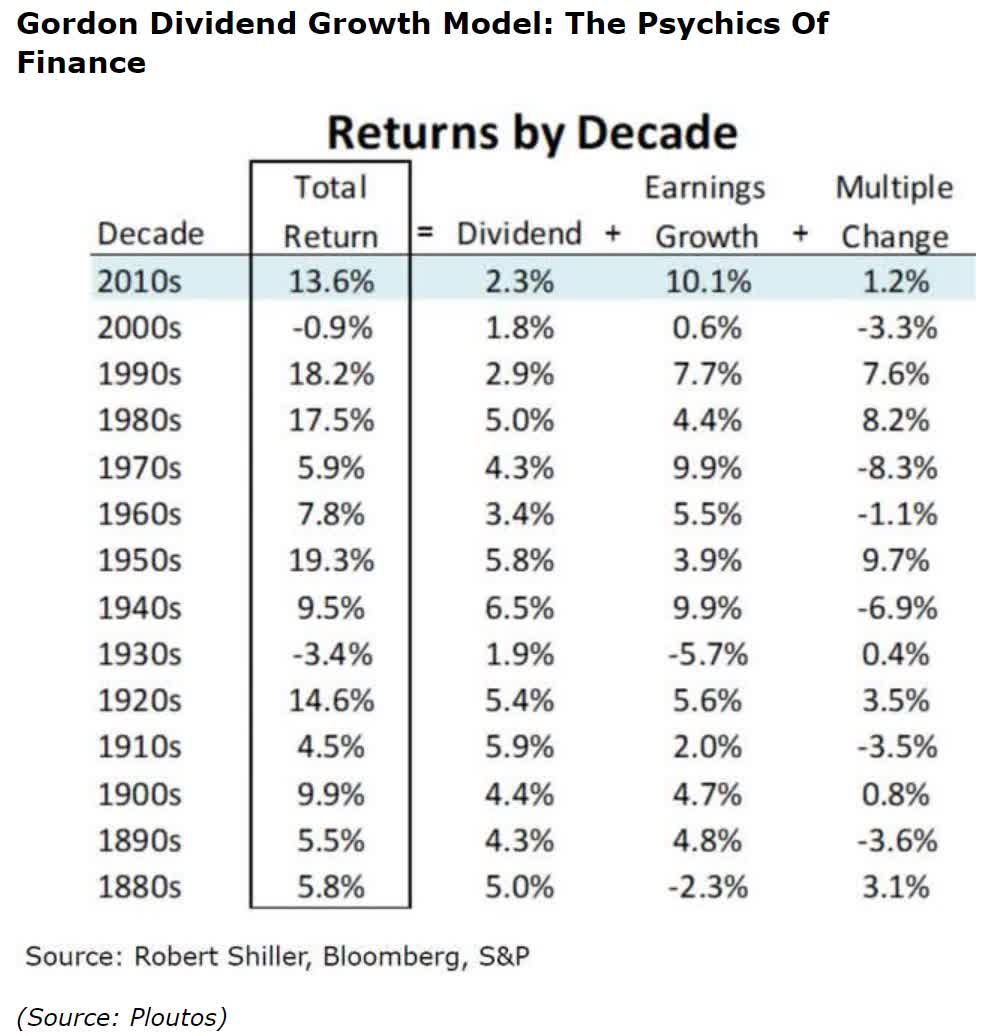
Valuation changes tend to cancel out over time and starting yield + long-term growth ends up determining virtually all of your returns. This is close to the Gospel truth as exists on Wall Street, about as basic as the idea that intrinsic value, which all companies eventually return to, is a function of future earnings, cash flow, and dividends.

(Source: Jill Mislinksi)
The market has averaged a 5+% pullback or correction every six months since 2009.
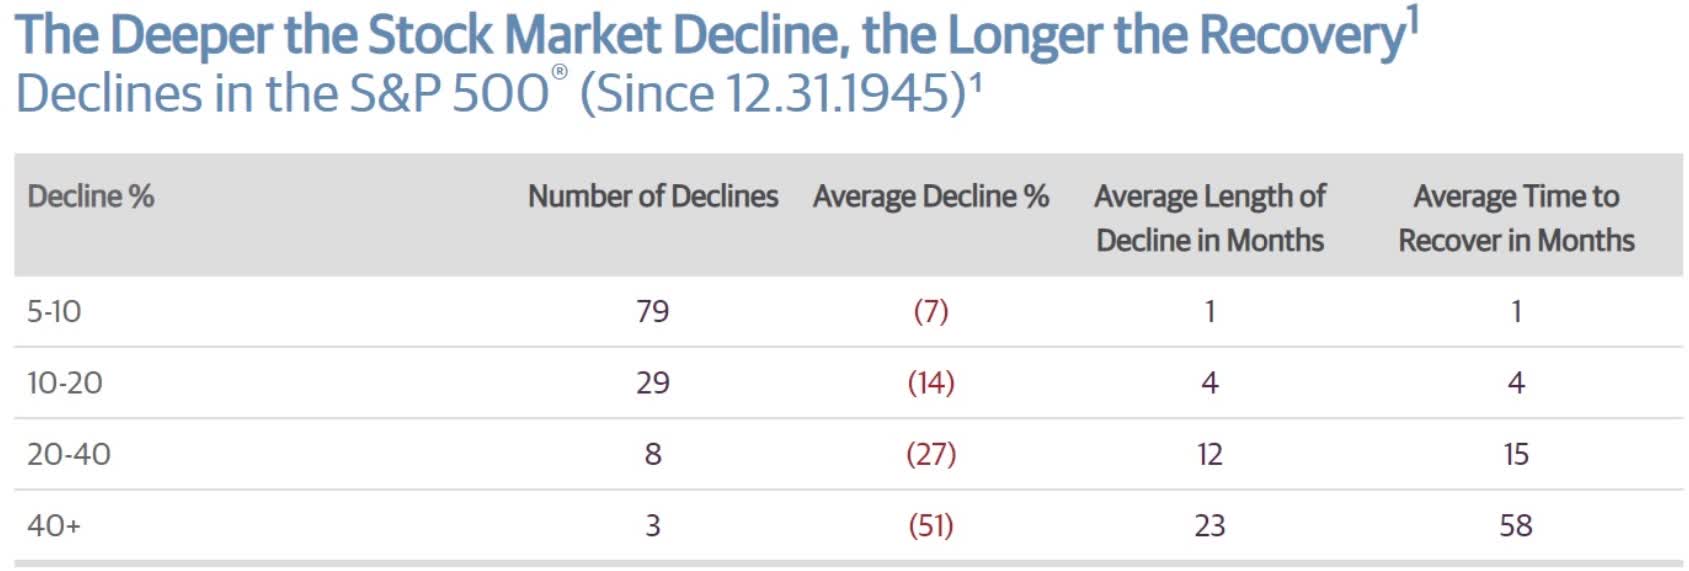
(Source: Guggenheim Partners, Ned Davis Research)
That’s also been the case since 1945. The average time to recover new highs from pullbacks is one month. Correction average four months to recover from. What if you had bought stocks on October 9th, 2007, literally just before the Great Recession tanked stocks 55%?

Investors still managed to double their money even with the worst timing possible and through two bear markets.

What if you had invested only at every single market top since 1970? Today you’d still be a millionaire as long as you invested $2K per year on average, even if you literally had the worst possible timing.
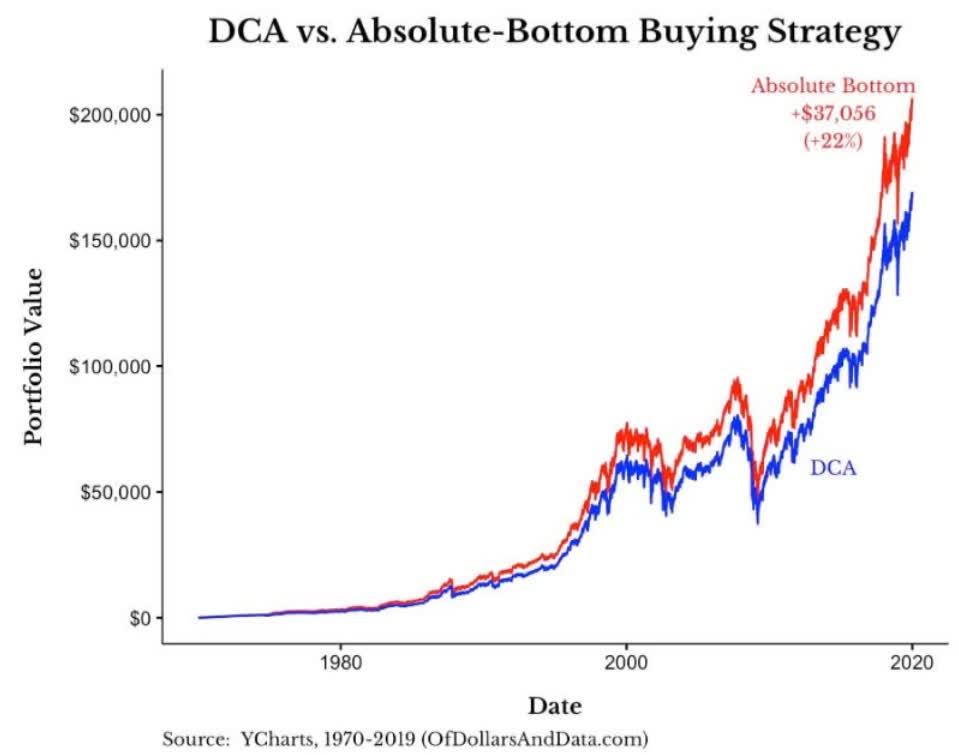
In contrast, had you perfectly timed the bottom since 1970? You’d have made an additional 22% over a period of 49 years, or 0.4% CAGR.
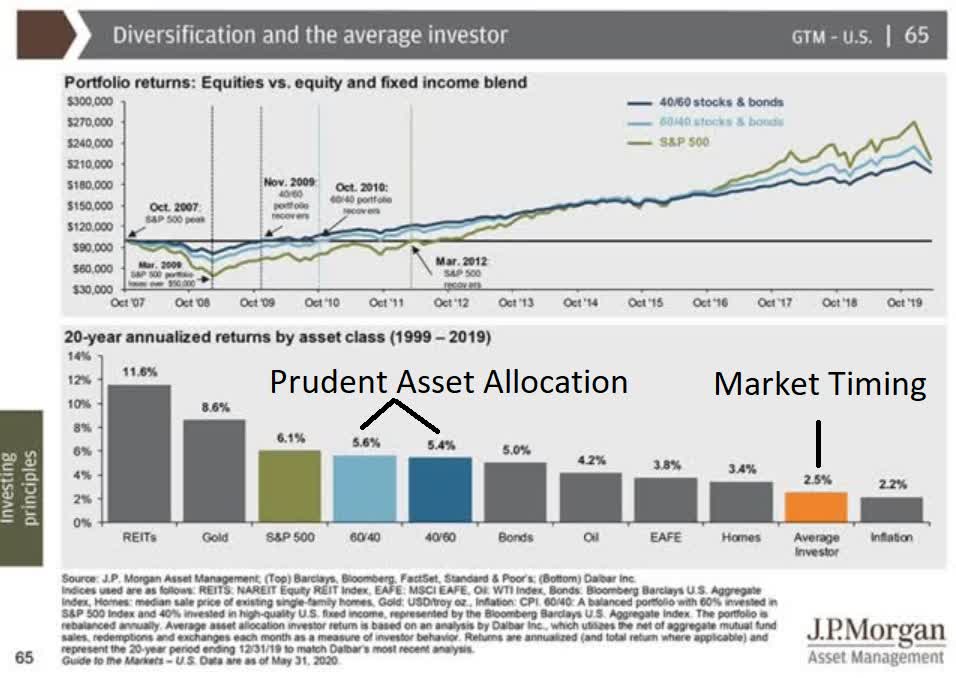
Trusting your overall portfolio’s construction and risk management is the easiest way to ignore market downturns like this. Trying to time the market is the 2nd biggest retirement killer in history, second only to insufficient savings.
- good long-term investors learn to tolerate and ignore periods of intense short-term volatility
- great long-term investors learn to embrace volatility and harness it for their goals
Want More Great Investing Ideas?
7 “Safe-Haven” Dividend Stocks for Turbulent Times
When Does the Next Bull Run Start?
Chart of the Day- See the Stocks Ready to Breakout
SPY shares were trading at $327.65 per share on Wednesday morning, down $2.65 (-0.80%). Year-to-date, SPY has gained 3.26%, versus a % rise in the benchmark S&P 500 index during the same period.
About the Author: Adam Galas

Adam has spent years as a writer for The Motley Fool, Simply Safe Dividends, Seeking Alpha, and Dividend Sensei. His goal is to help people learn how to harness the power of dividend growth investing. Learn more about Adam’s background, along with links to his most recent articles. More...
More Resources for the Stocks in this Article
| Ticker | POWR Rating | Industry Rank | Rank in Industry |
| SPY | Get Rating | Get Rating | Get Rating |


