American Airlines Group, Inc. (AAL): Price and Financial Metrics


American Airlines Group, Inc. (AAL): $14.52

0.17 (+1.18%)

POWR Rating

Component Grades

Growth

S

Value

I

Momentum

G

Stability

N

Sentiment

U

Quality

P

Add AAL to Watchlist
Sign Up

Industry: Airlines


Ranked

of

in industry

AAL POWR Grades

  • Growth is the dimension where AAL ranks best; there it ranks ahead of 97.48% of US stocks.
  • The strongest trend for AAL is in Value, which has been heading up over the past 177 days.
  • AAL ranks lowest in Stability; there it ranks in the 8th percentile.

AAL Stock Summary

  • The capital turnover (annual revenue relative to shareholder's equity) for AAL is -8.44 -- better than only 2.03% of US stocks.
  • Equity multiplier, or assets relative to shareholders' equity, comes in at -8.59 for AMERICAN AIRLINES GROUP INC; that's greater than it is for just 2.25% of US stocks.
  • Over the past twelve months, AAL has reported earnings growth of -387.17%, putting it ahead of merely 4.28% of US stocks in our set.
  • Stocks that are quantitatively similar to AAL, based on their financial statements, market capitalization, and price volatility, are EEX, RGS, MGI, HLF, and PRTH.
  • Visit AAL's SEC page to see the company's official filings. To visit the company's web site, go to www.aa.com.

AAL Valuation Summary

  • In comparison to the median Industrials stock, AAL's price/sales ratio is 81.82% lower, now standing at 0.2.
  • AAL's price/earnings ratio has moved up 78.2 over the prior 112 months.

Below are key valuation metrics over time for AAL.

Stock Date P/S P/B P/E EV/EBIT
AAL 2023-03-17 0.2 -1.6 71.7 23.9
AAL 2023-03-16 0.2 -1.6 72.4 24.0
AAL 2023-03-15 0.2 -1.6 71.1 23.9
AAL 2023-03-14 0.2 -1.6 75.2 24.1
AAL 2023-03-13 0.2 -1.7 76.2 24.2
AAL 2023-03-10 0.2 -1.7 79.3 24.4

AAL Growth Metrics

    The 3 year net cashflow from operations growth rate now stands at -49.34%.
  • The 2 year net cashflow from operations growth rate now stands at -14.08%.
  • Its 3 year net income to common stockholders growth rate is now at -268.72%.
AAL's revenue has moved up $8,601,000,000 over the prior 70 months.

The table below shows AAL's growth in key financial areas (numbers in millions of US dollars).

Date Revenue Operating Cash Flow Net Income to Common Stock
2022-12-31 48,971 2,173 127
2022-09-30 45,210 1,131 -1,608
2022-06-30 40,717 -16 -1,922
2022-03-31 34,773 1,715 -2,379
2021-12-31 29,882 704 -1,993
2021-09-30 24,483 -959 -3,240

AAL's Quality Factors

The “Quality” component of the POWR Ratings focuses on 31 different factors of a companies fundamentals and operational strength. Here are some key insights as we drill into the specifics of these quality attributes.
  • AAL has a Quality Grade of B, ranking ahead of 76.13% of graded US stocks.
  • AAL's asset turnover comes in at 0.361 -- ranking 52nd of 137 Transportation stocks.
  • DAL, UAL, and HA are the stocks whose asset turnover ratios are most correlated with AAL.

The table below shows AAL's key quality metrics over time.

Period Asset Turnover Gross Margin ROIC
2021-09-30 0.361 0.430 -0.028
2021-06-30 0.281 0.361 -0.069
2021-03-31 0.199 0.210 -0.106
2020-12-31 0.280 0.312 -0.134
2020-09-30 0.401 0.419 -0.094
2020-06-30 0.546 0.482 -0.047

AAL Price Target

For more insight on analysts targets of AAL, see our AAL price target page. And for a list of of all stocks sorted by upside potential based on analyst target price, see our Top Price Target page.

Average Price Target $19.92 Average Broker Recommendation 2.07 (Hold)

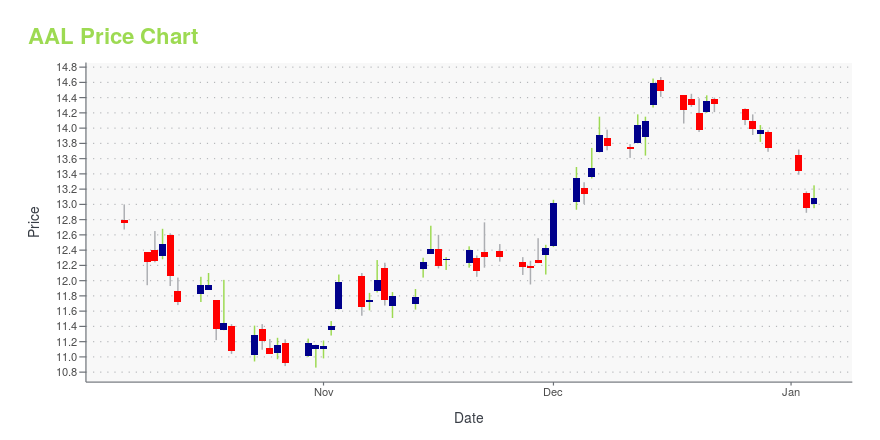
AAL Stock Price Chart Interactive Chart >

Price chart for AAL

AAL Price/Volume Stats

Current price $14.52 52-week high $21.42
Prev. close $14.35 52-week low $11.65
Day low $14.47 Volume 7,840,541
Day high $14.70 Avg. volume 24,797,377
50-day MA $15.69 Dividend yield N/A
200-day MA $14.28 Market Cap 9.46B

American Airlines Group, Inc. (AAL) Company Bio


American Airlines Group is the holding company for American Airlines and US Airways. Together with regional partners, operating as American Eagle and US Airways Express, the airlines operate an average of nearly 6,700 flights per day to nearly 350 destinations in more than 50 countries. American Airlines Group Inc. was founded in 1934 and is based in Fort Worth, Texas.


AAL Latest News Stream


Event/Time News Detail
Loading, please wait...

AAL Latest Social Stream


Loading social stream, please wait...

View Full AAL Social Stream

Latest AAL News From Around the Web

Below are the latest news stories about AMERICAN AIRLINES GROUP INC that investors may wish to consider to help them evaluate AAL as an investment opportunity.

Aviation Services Provider AAR Purchases Nine 757-200 Aircraft From American Airlines

Aviation services provider AAR Corp (NYSE: AIR) subsidiary AAR Supply Chain will acquire nine Boeing Company (NYSE: BA) 757-200 passenger aircraft equipped with 18 RB211 engines. The assets have been recently operated by American Airlines Group (NASDAQ: AAL). The financial terms of the deal were not disclosed. "The acquisition of these aircraft and engines will enable AAR to continue to support the RB211-powered 757 cargo market," said Brian Salvatori, AAR's Vice President of Asset Trading. Also

Yahoo | March 29, 2023

An Ergonomics Expert Explains How to Sleep on a Plane

Airplane ticket prices are going up, yet economy seat sizes are shrinking. Here’s how you can find a more comfortable position for your in-flight snooze in coach.

Yahoo | March 29, 2023

American Airlines (AAL) Up 14% in the Past 6 Months: Here's How

Solid travel demand as well as debt-reduction efforts boost American Airlines (AAL).

Yahoo | March 29, 2023

American Airlines Will Offer Its New Fares in Sabre From April 3

There’s no going back with the final global distribution system in place, so next week really is crunch time for whether corporate travel booking flows will face an apocalyptic disruption — or not.

Yahoo | March 29, 2023

Hawaiian Holdings' (HA) Arm Inks SAF-Related Deal With Gevo

The latest agreement with Gevo for sustainable aviation fuel is expected to boost Hawaiian Holdings' (HA) competitive position in the aviation industry.

Yahoo | March 28, 2023

Read More 'AAL' Stories Here

AAL Price Returns

1-mo -9.14%
3-mo 14.15%
6-mo 20.60%
1-year -19.56%
3-year 18.53%
5-year -71.38%
YTD 14.15%
2022 -29.18%
2021 13.89%
2020 -44.81%
2019 -9.57%
2018 -37.69%

Continue Researching AAL

Here are a few links from around the web to help you further your research on American Airlines Group Inc's stock as an investment opportunity:

American Airlines Group Inc (AAL) Stock Price | Nasdaq
American Airlines Group Inc (AAL) Stock Quote, History and News - Yahoo Finance
American Airlines Group Inc (AAL) Stock Price and Basic Information | MarketWatch

Get Free Updates

Join thousands of investors who get the latest news, insights and top rated picks from StockNews.com!


Page generated in 0.8646 seconds.