
Arcosa, Inc. (ACA): Price and Financial Metrics
ACA Price/Volume Stats
| Current price | $92.12 | 52-week high | $93.07 |
| Prev. close | $89.73 | 52-week low | $61.98 |
| Day low | $91.02 | Volume | 129,917 |
| Day high | $92.80 | Avg. volume | 226,148 |
| 50-day MA | $85.66 | Dividend yield | 0.22% |
| 200-day MA | $80.28 | Market Cap | 4.48B |
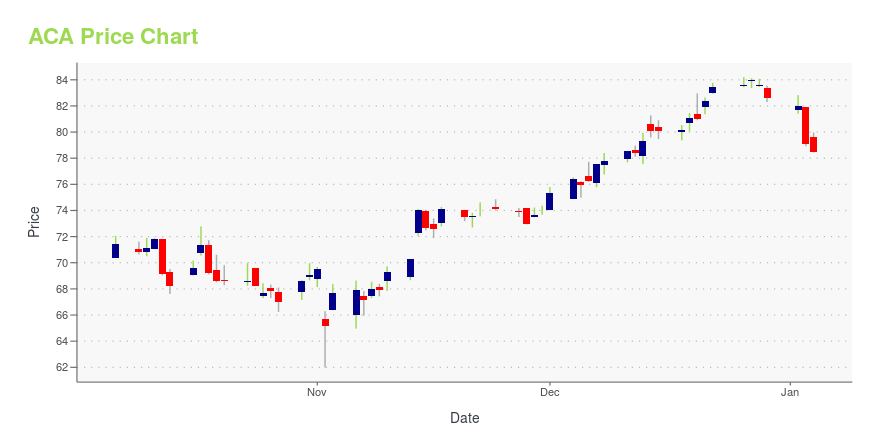
ACA Stock Price Chart Interactive Chart >
Arcosa, Inc. (ACA) Company Bio
Arcosa, Inc., together with its subsidiaries, provides infrastructure-related products and solutions for the construction, energy, and transportation markets in North America. It operates through three segments: Construction Products Group, Energy Equipment Group, and Transportation Products Group. The Construction Products Group segment offers natural and lightweight aggregates, trench shields, shoring products, and specialty milled or processed materials that are used in construction landscape, including commercial, industrial, road and bridge, and underground construction. It serves equipment rental dealers, as well as commercial, residential, and industrial contractors. The Energy Equipment Group segment provides structural wind towers for wind turbine producers; steel utility structures for electricity transmission and distribution; pressurized and non-pressurized tanks that store and transport various products, including propane, anhydrous ammonia, and natural gas liquids; and fertilizer storage containers for agricultural markets. The Transportation Products Group segment offers hopper barges, tank barges, fiberglass covers, hatches, castings, and winches for commercial marine transportation companies and industrial shippers; axles, circular forgings, and coupling devices for freight, tank, locomotive, and passenger rail transportation equipment, as well as for other industrial uses; and cast components for use in the industrial and mining sectors. The company was incorporated in 2018 and is headquartered in Dallas, Texas.
Latest ACA News From Around the Web
Below are the latest news stories about ARCOSA INC that investors may wish to consider to help them evaluate ACA as an investment opportunity.
Arcosa (NYSE:ACA) jumps 5.5% this week, though earnings growth is still tracking behind five-year shareholder returnsWhen you buy shares in a company, it's worth keeping in mind the possibility that it could fail, and you could lose... |
Estimating The Fair Value Of Arcosa, Inc. (NYSE:ACA)Key Insights The projected fair value for Arcosa is US$65.87 based on 2 Stage Free Cash Flow to Equity Arcosa's... |
Arcosa, Inc. (NYSE:ACA) Q3 2023 Earnings Call TranscriptArcosa, Inc. (NYSE:ACA) Q3 2023 Earnings Call Transcript November 2, 2023 Operator: Good morning, ladies and gentlemen, and welcome to the Arcosa, Inc. Third Quarter 2023 Earnings Conference Call. My name is Shelby, and I will be your conference call coordinator today. As a reminder, today’s call is being recorded. Now, I would like to […] |
Arcosa Inc (ACA) Reports 11% Increase in Net Income for Q3 2023Adjusted EBITDA Growth of 24% Led by Construction and Transportation Products |
Arcosa, Inc. Announces Third Quarter 2023 ResultsDALLAS, November 01, 2023--Arcosa, Inc. (NYSE: ACA) ("Arcosa," the "Company," "We," or "Our"), a provider of infrastructure-related products and solutions, today announced results for the third quarter ended September 30, 2023. |
ACA Price Returns
| 1-mo | 11.48% |
| 3-mo | 19.18% |
| 6-mo | 17.46% |
| 1-year | 23.60% |
| 3-year | 73.74% |
| 5-year | 157.41% |
| YTD | 11.67% |
| 2023 | 52.54% |
| 2022 | 3.51% |
| 2021 | -3.73% |
| 2020 | 23.87% |
| 2019 | 61.89% |
ACA Dividends
| Ex-Dividend Date | Type | Payout Amount | Change | ||||||
|---|---|---|---|---|---|---|---|---|---|
| Loading, please wait... | |||||||||
Continue Researching ACA
Want to do more research on Arcosa Inc's stock and its price? Try the links below:Arcosa Inc (ACA) Stock Price | Nasdaq
Arcosa Inc (ACA) Stock Quote, History and News - Yahoo Finance
Arcosa Inc (ACA) Stock Price and Basic Information | MarketWatch
Loading social stream, please wait...