Acco Brands Corporation (ACCO): Price and Financial Metrics
ACCO Price/Volume Stats
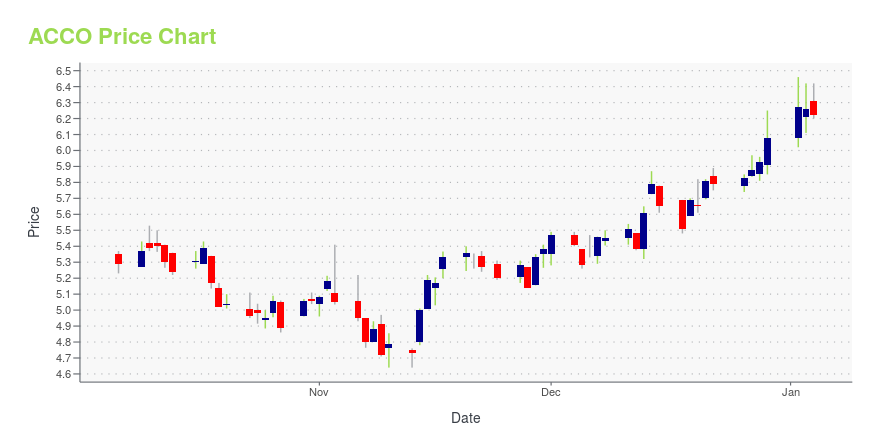
Current price | $4.83 | 52-week high | $7.56 |
Prev. close | $5.01 | 52-week low | $4.27 |
Day low | $4.81 | Volume | 517,827 |
Day high | $5.02 | Avg. volume | 550,012 |
50-day MA | $5.00 | Dividend yield | 5.99% |
200-day MA | $5.44 | Market Cap | 458.45M |
ACCO Stock Price Chart Interactive Chart >
ACCO POWR Grades
- Sentiment is the dimension where ACCO ranks best; there it ranks ahead of 94.8% of US stocks.
- The strongest trend for ACCO is in Growth, which has been heading up over the past 179 days.
- ACCO ranks lowest in Momentum; there it ranks in the 22nd percentile.
ACCO Stock Summary
- Price to trailing twelve month operating cash flow for ACCO is currently 3.07, higher than just 14.75% of US stocks with positive operating cash flow.
- ACCO's price/sales ratio is 0.26; that's higher than the P/S ratio of just 8.72% of US stocks.
- Shareholder yield, a measure of how much is returned to shareholders via dividends and share repurchases, for ACCO comes in at 19.06% -- higher than that of 90.25% of stocks in our set.
- Stocks with similar financial metrics, market capitalization, and price volatility to ACCO BRANDS CORP are GFAI, TDS, GIII, ALYA, and PRG.
- ACCO's SEC filings can be seen here. And to visit ACCO BRANDS CORP's official web site, go to www.accobrands.com.
ACCO Valuation Summary
- In comparison to the median Industrials stock, ACCO's EV/EBIT ratio is 57.96% higher, now standing at 24.8.
- ACCO's price/sales ratio has moved down 0.8 over the prior 216 months.
Below are key valuation metrics over time for ACCO.
Stock | Date | P/S | P/B | P/E | EV/EBIT |
---|---|---|---|---|---|
ACCO | 2023-05-19 | 0.3 | 0.6 | -34.4 | 24.8 |
ACCO | 2023-05-18 | 0.3 | 0.6 | -34.8 | 24.9 |
ACCO | 2023-05-17 | 0.3 | 0.6 | -35.3 | 25.0 |
ACCO | 2023-05-16 | 0.3 | 0.6 | -34.7 | 24.9 |
ACCO | 2023-05-15 | 0.3 | 0.6 | -35.8 | 25.1 |
ACCO | 2023-05-12 | 0.3 | 0.6 | -34.8 | 24.9 |
ACCO Growth Metrics
- Its 5 year price growth rate is now at -49.4%.
- Its year over year net income to common stockholders growth rate is now at 255.95%.
- Its 3 year net income to common stockholders growth rate is now at 24.97%.

The table below shows ACCO's growth in key financial areas (numbers in millions of US dollars).
Date | Revenue | Operating Cash Flow | Net Income to Common Stock |
---|---|---|---|
2022-12-31 | 1,947.6 | 77.6 | -13.2 |
2022-09-30 | 2,018.5 | 106 | 21.5 |
2022-06-30 | 2,059.6 | 116.8 | 110.4 |
2022-03-31 | 2,056.4 | 97.8 | 119.6 |
2021-12-31 | 2,025.3 | 159.6 | 101.9 |
2021-09-30 | 1,915.1 | 141.4 | 78.2 |
ACCO's Quality Factors
The “Quality” component of the POWR Ratings focuses on 31 different factors of a companies fundamentals and operational strength. Here are some key insights as we drill into the specifics of these quality attributes.- ACCO has a Quality Grade of C, ranking ahead of 45.31% of graded US stocks.
- ACCO's asset turnover comes in at 0.623 -- ranking 7th of 14 Printing and Publishing stocks.
- SCHL, GCI, and NYT are the stocks whose asset turnover ratios are most correlated with ACCO.
The table below shows ACCO's key quality metrics over time.
Period | Asset Turnover | Gross Margin | ROIC |
---|---|---|---|
2021-09-30 | 0.623 | 0.303 | 0.068 |
2021-06-30 | 0.615 | 0.300 | 0.067 |
2021-03-31 | 0.584 | 0.295 | 0.046 |
2020-12-31 | 0.593 | 0.297 | 0.066 |
2020-12-31 | 0.593 | 0.297 | 0.066 |
2020-09-30 | 0.635 | 0.309 | 0.086 |
Acco Brands Corporation (ACCO) Company Bio
ACCO Brands manufactures and markets office, school, and calendar products, and select computer and electronic accessories. The company was founded in 2005 and is based in Lake Zurich, Illinois.
Latest ACCO News From Around the Web
Below are the latest news stories about ACCO BRANDS CORP that investors may wish to consider to help them evaluate ACCO as an investment opportunity.
ACCO Brands (NYSE:ACCO) Is Paying Out A Dividend Of $0.075ACCO Brands Corporation's ( NYSE:ACCO ) investors are due to receive a payment of $0.075 per share on 9th of June... |
Dividend Investors: Don't Be Too Quick To Buy ACCO Brands Corporation (NYSE:ACCO) For Its Upcoming DividendRegular readers will know that we love our dividends at Simply Wall St, which is why it's exciting to see ACCO Brands... |
Q1 2023 ACCO Brands Corp Earnings CallQ1 2023 ACCO Brands Corp Earnings Call |
Acco Brands (ACCO) Surpasses Q1 Earnings and Revenue EstimatesAcco (ACCO) delivered earnings and revenue surprises of 80% and 2.57%, respectively, for the quarter ended March 2023. Do the numbers hold clues to what lies ahead for the stock? |
ACCO Brands Reports First Quarter 2023 Results Highlighted by Improved Margins and Cash FlowLAKE ZURICH, Ill., May 04, 2023--ACCO Brands Corporation (NYSE: ACCO) today announced its first quarter results for the period ended March 31, 2023. |
ACCO Price Returns
1-mo | 6.98% |
3-mo | -10.48% |
6-mo | -11.28% |
1-year | N/A |
3-year | -11.92% |
5-year | -54.94% |
YTD | -11.13% |
2022 | -29.22% |
2021 | 0.77% |
2020 | -5.85% |
2019 | 41.92% |
2018 | -43.22% |
ACCO Dividends
Ex-Dividend Date | Type | Payout Amount | Change | ||||||
---|---|---|---|---|---|---|---|---|---|
Loading, please wait... |
Continue Researching ACCO
Want to see what other sources are saying about ACCO BRANDS Corp's financials and stock price? Try the links below:ACCO BRANDS Corp (ACCO) Stock Price | Nasdaq
ACCO BRANDS Corp (ACCO) Stock Quote, History and News - Yahoo Finance
ACCO BRANDS Corp (ACCO) Stock Price and Basic Information | MarketWatch
Loading social stream, please wait...