
Ameren Corp. (AEE): Price and Financial Metrics
AEE Price/Volume Stats
| Current price | $78.04 | 52-week high | $88.17 |
| Prev. close | $77.55 | 52-week low | $67.03 |
| Day low | $77.37 | Volume | 976,384 |
| Day high | $78.48 | Avg. volume | 1,701,593 |
| 50-day MA | $72.54 | Dividend yield | 3.57% |
| 200-day MA | $73.36 | Market Cap | 20.81B |
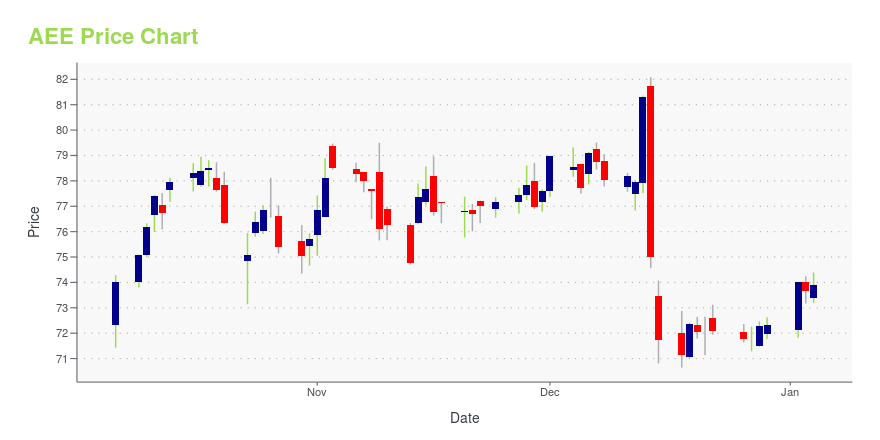
AEE Stock Price Chart Interactive Chart >
Ameren Corp. (AEE) Company Bio
Ameren Corporation is an American power company created December 31, 1997, by the merger of St. Louis, Missouri's Union Electric Company (formerly NYSE: UEP) and the neighboring Central Illinois Public Service Company (CIPSCO Inc. holding, formerly NYSE: CIP) of Springfield, Illinois. It is now a holding company for several power companies and energy companies. The company is based in St. Louis, serving 2.4 million electric, and 900,000 natural gas customers across 64,000 square miles in central and eastern Missouri and the southern four-fifths of Illinois by area. (Source:Wikipedia)
Latest AEE News From Around the Web
Below are the latest news stories about AMEREN CORP that investors may wish to consider to help them evaluate AEE as an investment opportunity.
Ameren Missouri prices its first mortgage bonds due 2054More on Ameren |
Exelon, ComEd, Ameren outlooks lowered by financial firms after regulator rejects grid plansWhile recent Illinois Commerce Commission decisions may hurt the utilities’ credit and financial outlook, consumer advocates said the agency’s actions protect ratepayers. |
Ameren issues updated climate strategy report, including actions toward a just and equitable energy transitionToday, Ameren Corporation (NYSE: AEE) published its latest climate report aligned with the Task Force on Climate-related Financial Disclosures (TCFD) recommendations. The report highlights actions Ameren is taking to manage climate-related risks and reliably transition to a cleaner energy future while achieving its goal of net-zero carbon emissions by 2045. |
Ameren (AEE) is a Top-Ranked Growth Stock: Should You Buy?The Zacks Style Scores offers investors a way to easily find top-rated stocks based on their investing style. Here's why you should take advantage. |
Ameren Announces Pricing of Senior Notes due 2029Ameren Corporation (NYSE: AEE) announced today the pricing of a public offering of $700 million aggregate principal amount of its 5.00% senior notes due 2029 at 99.774% of their principal amount. The transaction is expected to close on December 21, 2023, subject to the satisfaction of customary closing conditions. |
AEE Price Returns
| 1-mo | 11.28% |
| 3-mo | 6.95% |
| 6-mo | 14.37% |
| 1-year | -6.73% |
| 3-year | 0.33% |
| 5-year | 17.30% |
| YTD | 9.90% |
| 2023 | -16.07% |
| 2022 | 2.54% |
| 2021 | 17.09% |
| 2020 | 4.26% |
| 2019 | 20.82% |
AEE Dividends
| Ex-Dividend Date | Type | Payout Amount | Change | ||||||
|---|---|---|---|---|---|---|---|---|---|
| Loading, please wait... | |||||||||
Continue Researching AEE
Want to do more research on Ameren Corp's stock and its price? Try the links below:Ameren Corp (AEE) Stock Price | Nasdaq
Ameren Corp (AEE) Stock Quote, History and News - Yahoo Finance
Ameren Corp (AEE) Stock Price and Basic Information | MarketWatch
Loading social stream, please wait...